2018 Proxy Statement to hold office until the next Annual Meeting of Shareholders and until their respective successors have been duly elected and qualified, (2) approve the advisory resolution to approve Named Executive Officers’ compensation, and (3) ratify the appointment of KPMG LLP, an independent registered public accounting firm, as the Company’s auditors for the year ending December 31, 2016.Shareholders may also be asked to consider and take action with respect to such other matters as may properly come before the Annual Meeting.
Copies of the Company’s Annual Report on Form 10-K for the year ended December 31, 2015 (“Annual Report”), including the Company’s audited consolidated financial statements, were made available to known Shareholders on or about February 29, 2016.
| • General Information | | 1 | 2016 Proxy Statement • General Information | | 1 |
Your Proxy Vote How to Vote | (1) | Via Internet: Go to www.proxyvote.com to vote via the Internet. You will need to follow the instructions on your Notice of Internet Availability of Proxy Materials (“Notice”) or proxy card and the website. If you vote via the Internet, you may incur telephone and Internet access charges. |
| (2) | By Telephone: Call the toll-free telephone number on the proxy card or the website to vote by telephone. You will need to follow the instructions and the voice prompts. |
| (3) | By Mail: Request, complete and return a paper proxy card, following the instructions on your Notice. |
| (4) | In Person: Attend the Annual Meeting, or send a personal representative with an appropriate proxy, to vote by ballot. |
If you vote via the Internet or by telephone, your electronic vote authorizes the named proxies in the same manner as if you signed, dated and returned your proxy card.If you vote via the Internet or by telephone, do not return your proxy card. If your shares are held in “street name” (that is, in the name of a bank, broker or other holder of record), you will receive a Notice containing instructions from the holder of record that you must follow in order for your shares to be voted. Internet and/or telephone voting also will be offered to Shareholders owning shares through most banks and brokers. Participants in the Company’s stock fund within the Horace Mann Service Corporation Supplemental Retirement and Savings 401(k) Plan can direct the trustee to vote their shares via the Internet as directed in the Notice, by telephone as provided on the website or proxy card, or by signing and returning a proxy card. Voting Rules Solicitation and Revocation Your proxy is being solicited by and on behalf of the Board. The persons named in the Form of Proxy have been designated as proxies by the Board. Such persons are Directors of the Company. Shares of Common Stock represented at the Annual Meeting by a properly executed and returned proxy will be voted at the Annual Meeting in accordance with the instructions noted thereon, or if no instructions are noted, the proxy will be voted in favor of the proposals set forth in the Notice of Annual Meeting. A submitted proxy is revocable by a Shareholder at any time prior to it being voted, provided that such Shareholder gives written notice to the Corporate Secretary at or prior to the Annual Meeting that such Shareholder intends to vote in person or by submitting a subsequently dated proxy. Attendance at the Annual Meeting by a Shareholder who has given a proxy shall not in and of itself constitute a revocation of such proxy. Further solicitation may be made by officers and other employees of the Company personally, by telephone or otherwise, but such persons will not be specifically compensated for such services. Banks, brokers, nominees and other custodians and fiduciaries will be reimbursed for their reasonableout-of-pocket expenses in forwarding soliciting material to their principals, the beneficial owners of Common Stock. The costs of soliciting proxies will be borne by the Company. It is estimated these costs will be nominal. Shareholder Approval Shareholders are entitled to one vote per share of Common Stock on all matters submitted for consideration at the Annual Meeting. Under the Company’s Bylaws, the affirmative vote of a majority of the shares of Common Stock represented in person or by proxy at the Annual Meeting is required for the election of Directors, approval of the advisory resolution to approve Named Executive Officers’ compensation, and the ratification of the appointment of KPMG LLP as the Company’s independent registered public accounting firm for the year ending December 31, 2016.2018. Abstentions have the same effect as a vote “against” approval of the matter. Please note that under New York Stock Exchange (“NYSE”) rules, brokers who hold | | | | 2 | | 2018 Proxy Statement • Your Proxy Vote |
shares of Common Stock in street name for customers have the authority to vote on certain items when they have not received instructions from beneficial owners. With respect to the matters to come before the Annual Meeting, if brokers are not entitled to vote without instructions and therefore cast brokernon-votes, the brokernon-votes will have no direct effect on the outcome of the vote. However, because each matter requires a majority vote of the outstanding shares present and entitled to vote, a brokernon-vote will indirectly work against the matter for which a brokernon-vote is cast. For this Annual Meeting, if you do not give specific instructions, your broker may cast your vote in its discretion on only Proposal No. 3 - Ratification of Independent Registered Public Accounting Firm. Other Matters Other than the matters set forth below, the Board has not received any Shareholder proposal by the deadline prescribed by the rules of the SEC,Securities and Exchange Commission (“SEC”), and otherwise knows of no other matters to be brought before the Annual Meeting. However, should any other matters properly come before the meeting, the persons named in the Form of Proxy will vote or refrain from voting thereon at their discretion. | | | 2 | | 20162018 Proxy Statement • Your Proxy Vote | | 3 |
Proposals and Company Information PROPOSAL NO. 1 - ELECTION OF NINE DIRECTORS The By-LawsBylaws of the Company provide for the Company to have not less than five or more than fifteen Directors. The following nine persons currently are serving as Directors of the Company (“Directors”): Daniel A. Domenech, Mary H. Futrell, Stephen J. Hasenmiller, Ronald J. Helow, Beverley J. McClure, H. Wade Reece, Gabriel L. Shaheen, Robert Stricker, Steven O. Swyers and Marita Zuraitis. The terms of these Directors expire at the Annual Meeting. Dr. Futrell will be retiring from the Board as of the Annual Meeting, and the Board has nominated H. Wade Reece to serve as a new Director of the Company. We thank Dr. Futrell for her exemplary service.Qualifications The Board of Directors believes it is necessary for each of the Company’s Directors to possess a variety of qualities and skills. The Nominating & Governance Committee conducts all necessary and appropriate inquiries into the background and qualifications of Board candidates including the determination of independence. In addition, the Nominating & Governance Committee has identified areas of expertise that it believes support the Company’s business strategy in the short and long-term, enable the Board to exercise its oversight function and contribute to a well-rounded Board. The list below highlights certain key qualifications and experience of our current Board. | | | | | ✓ Education Background | | ✓ Technology | | ✓ Leadership Background | ✓ Niche Market | | ✓ Financial Services | | ✓ Financial Expert | ✓ Insurance Operations | | ✓ Customer Experience | | ✓ Investments | ✓ Agency Management | | ✓ Insurance Brokerage | | |
Board Diversity, Age and Tenure The Nominating & Governance Committee does not have a formal diversity policy; however, the Board and the Nominating & Governance Committee believe that it is important that the Board be comprised of individuals with expertise in fields relevant to the Company’s business, experience from different professions, a diversity of age, ethnicity and gender, and a range of tenures. The Nominating & Governance Committee is responsible for reviewing with the Board, on an annual basis, the requisite skills and characteristics of new Board members as well as the composition of the Board as a whole. This assessment includes members’ qualifications as independent,consideration of experience, perspective, background, skill sets, age, ethnicity, and gender makeup of the current Board as well as consideration of skills, experience, diversitythe candidate’s individual qualities in leadership, character judgment and ethical standards. | | | | 4 | | 2018 Proxy Statement • Proposals and Company Information |
Diversity age in the context of the needs of the Board. tenure
The Nominating & Governance Committee does not havebelieves our Board Nominees (as identified below) represent a formaldiverse base of perspectives and reflect the diversity policy; however,of the Company’s employees, customers and Shareholders, as well as an appropriate level of age and tenure, as further illustrated below. 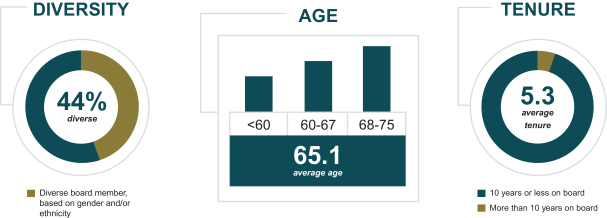
Board Refreshment The Board and the Nominating & Governance Committee believe that it is essential thatregularly consider the long-term make up of the Board and how the members represent diverse viewpoints.of the Board change over time. The Board and Nominating & Governance Committee assessesunderstand the effectivenessimportance of Board refreshment and strive to balance the criteria described above when evaluating new Board candidates and when assessing the composition ofknowledge that comes from longer-term service on the Board aswith the new experience, ideas and energy that can come from adding directors to the Board. Directors who are 75 years of age or older may not stand for election in the absence of a whole.specific finding by the Board that there are special circumstances to justify an exception, which supports Board refreshment. As Horace Mann continues to focus on profitable growth across all lines of business, the ongoing transformation of its technology and operations, and exploring inorganic growth opportunities, we will continue to consider Board refreshment opportunities. | | | | 2018 Proxy Statement • Proposals and Company Information | | 5 |
Board Nominees Upon the recommendation of the Nominating & Governance Committee, the Board nominated Dr. Domenech, Mr. Hasenmiller, Mr. Helow, Mr. Hines, Ms. McClure, Mr. Reece, Mr. Shaheen, Mr. Stricker, Mr. Swyers and Ms. Zuraitis (the “Board Nominees”) to hold office as Directors. The proxies solicited by and on behalf of the Board will be voted “FOR” the election of the Board Nominees unless you specify otherwise. The Company has no reason to believe that any of the foregoing Board Nominees is not available to serve or will not serve if elected, although in the unexpected event that any such Board Nominee should become unavailable to serve as a Director, full discretion is reserved to the persons named as proxies to vote for such other persons as may be nominated, or the Board may reduce the size of the Board. Each Director will serve until the next Annual Meeting of Shareholders and until his or her respective successor is duly elected and qualified. Board Nominees
The following information, as of March 15, 2016,2018, is provided with respect to each Board Nominee: | | | | | | | | |  
| | Daniel A. Domenech Age: 7072 Director Since: 2015 Horace Mann Committees: Customer Experience & Technology InvestmentNominating & FinanceGovernance
| | Dr. Domenech has served as the Executive Director of American Association of School Administrators (“AASA”), The School Superintendents Association, a professional organization for educational leaders, since July 2008. He is currently Chairman of the Board of the Communities in Schools of Virginia and the National Student Clearinghouse Research Center and is a member of the Board of Directors of Learning First Alliance, America’s Promise, the Center for Naval Analyses, ACT and Universal Service Administrative Company (“USAC”). where he Chairs the Schools and Libraries Committee. Dr. Domenech is also a past President of the New York State Council of School Superintendents, the Suffolk County Superintendents Association and the Suffolk County Organization for Promotion of Education, and was the first President and cofounder of the New York State Association for Bilingual Education. In addition, he has served on the U.S. Department of Education’s National Assessment Governing Board, on the Advisory Board for the Department of Defense schools, on the Board of Directors for the Baldrige Award and on the National Board for Professional Teaching Standards. Dr. Domenech has more than 40 years of experience in public education. Dr. Domenech’s experience in public education provides the Board with valuable insight into the Company’s niche market and the challenges and opportunities within that market. |
| | | 20166 | | 2018 Proxy Statement • Proposals and Company Information | | 3 |
| | | | | | | | |  
| | Stephen J. Hasenmiller Age: 6668 Director Since: 2004 Horace Mann Committees: Compensation (Chair) ExecutiveAudit
Nominating & GovernanceExecutive
| | Mr. Hasenmiller retired in March 2001 after 24 years of service at The Hartford Financial Services Group, Inc., as Senior Vice President - Personal-Personal Lines. Mr. Hasenmiller’s prior affiliations include his tenure as Chairman of the Personal Lines Committee of the American Insurance Association (1999-2001) and membership on the Boards of Directors of the Institute for Business & Home Safety (1996-2001) and the Insurance Institute for Highway Safety (1995-2001). Mr. Hasenmiller’s seasoned insurance background in the personal lines business, including both direct sales and agency distribution, as well as his understanding and experience in dealing with complex insurance issues, provides the Board with a valuable perspective. | | | | 
| | Ronald J. Helow Age: 7173 Director Since: 2009 Horace Mann Committees: Customer Experience & Technology (Chair) AuditExecutive
ExecutiveNominating & Governance
| | Mr. Helow is managing director of New Course Advisors, a consulting firm he founded in 2008 to advise companies on how to use advanced technologies to create a competitive advantage. Mr. Helow served from 2001 to 2008 as Partner and Chief Technology Officer at NxtStar Ventures, LLC, a firm providing consulting services to life insurance and retail financial services businesses, and founded Registry Systems Corporation in 1990 to custom design and implement mission critical projects using advanced computer technologies for insurance companies. Mr. Helow’s past experience in developing and securing solutions to insurance company operating challenges through technology brings to the Board unique knowledge and perspective. |
| | | | 2018 Proxy Statement • Proposals and Company Information | | 7 |
| | | | | | | |  | | Perry G. Hines Age: 55 Board Nominee | | Mr. Hines is a retired corporate marketing executive and is the principal and owner of The Hines Group, LLC, a firm he formed in 2006 specializing in marketing, communications and strategic planning. He has over 27 years of cross-sector experience in general management, brand, communications and marketing. Mr. Hines previously served as Senior Vice President, Chief Marketing and Communications Officer for Irwin Mortgage Corporation, a position he held from 2002 to 2007, Senior Vice President, Chief Marketing and Sales Officer of Lincoln Reinsurance Corporation from 1998 to 2002 and Vice President of Marketing & Communications of Safeco from 1995 to 1998. He has held management roles and stewarded well-known household brands. In addition to his consulting practice, he currently serves as the Director of Advancement for Covenant Christian High School. Mr. Hines’ cross-sector expertise in general management, brand building and strategic marketing will bring unique perspective and insight to the Board. | | | |  | | Beverley J. McClure Age: 6163 Director Since: 2013 Horace Mann Committees: Audit Compensation Customer Experience & Technology | | Ms. McClure retired in 2007 after a 35 year career with United Services Automobile Association (“USAA”), as Senior Vice President, Enterprise Operations. She is owner of Fresh Perspectives LLC, a firm she founded in 2007 which specializes in executive coaching and small business consulting. Ms. McClure previously served as Senior Advisor of Endeavor Management, a consulting firm specializing in service culture creation, leadership coaching, business transformation, operational execution, and customer experience management, a position she held from 2010 to 2013. She holds the Chartered Life Underwriter and Fellow, Life Management Institute designations and is a certified executive coach through the International Coach Federation. Ms. McClure’s broad experience in the areas of service excellence, customer experience, culture creation, employee engagement and quality management provides the Board with a valuable perspective. |
| | | 48 | | 20162018 Proxy Statement • Proposals and Company Information |
| | | | | | | | |  
| | H. Wade Reece Age: 5961 Board NomineeDirector Since:2016
Horace Mann Committees: Customer Experience & Technology Investment & Finance Nominating & Governance | | Mr. H. Wade Reece retired in 2015 after a 37 year career with BB&T Corporation (“BB&T”) where he served as the Chairman of the Board and Chief Executive Officer of BB&T Insurance Services, Inc. and BB&T Insurance Holdings, Inc., the sixth largest insurance broker globally. Until his retirement in 2015, Mr. Reece served as Vice Chairman of the Foundation of Agency Management Excellence (“FAME”) Board of Directors and a member of the Executive Committee of The Institutes (American Institute for Chartered Property Casualty Underwriters and Insurance Institute of America). He was also a past Chairman of the Council of Insurance Agents & Brokers and past Chairman of the Board of Trustees of The Institutes. Mr. Reece currently is a member of the Board of Directors of the North Carolina State University Foundation and the Blue Ridge Conservancy. Mr. Reece’sin-depth knowledge of the insurance industry, leadership skills and broad experience with agency management will provide the Board with industry insight and perspective. | | | | 
| | Gabriel L. Shaheen
Age: 62
Director Since: 2007
Chairman Since: 2010
Horace Mann Committees:
Executive (Chair)
Nominating & Governance (Chair)
Compensation
| | Mr. Shaheen retired in 1999 after 22 years of service with Lincoln National Corporation, including service as President and Chief Executive Officer of Lincoln National Life Insurance Company, Managing Director of Lincoln UK, and President and Chief Executive Officer of Lincoln National Reinsurance Companies. Since 2000, he has been Chief Executive Officer of GLS Capital Ventures, LLC and Partner of NxtStar Ventures, LLC, firms providing consulting services to life insurance and retail financial services businesses. He is currently a member of the Board of Directors of M Financial Holdings Incorporated and Steel Dynamics, Inc., one of the largest steel producers and metals recyclers in the United States. Mr. Shaheen holds the Fellow of the Society of Actuaries designation.
Mr. Shaheen’s insurance experience, technical insurance expertise and leadership background are valuable Board resources and contribute to Board discussion of issues impacting the Company.
| | | |  
| | Robert Stricker Age: 6971 Director Since: 2009 Horace Mann Committees: Investment & Finance (Chair) Audit
Customer Experience & Technology | | Mr. Stricker retired from Shenkman Capital Management, Inc., an investment management firm, in March 2009 as Senior Vice President and Principal. Prior to joining Shenkman, he served as Managing Director, Head of U.S. Fixed Income, Citigroup Asset Management at Citigroup, Inc. from 1994 to 2001. Mr. Stricker has over 40 years of experience in the financial services industry. He currently serves as a Director of the CQS Directional Opportunities Feeder Fund Ltd. and on the OPEB Trust Board of the town of Greenwich, Connecticut. Mr. Stricker holds the Chartered Financial Analyst designation. Mr. Stricker’s investment knowledge and financial services industry experience provide the Board with financial insights and assist the Board in its oversight responsibilities. |
| | | 20162018 Proxy Statement • Proposals and Company Information | | 59 |
| | | | | | | | |  
| | Steven O. Swyers Age: 6567 Director Since: 2014 Horace Mann Committees: Audit (Chair) Investment & Finance | | Mr. Swyers retired in 2013 after a 40 year career with PricewaterhouseCoopers LLP (“PwC”), a public accounting firm. During this time with PwC, he served as the lead engagement partner on many national and international companies, including those in the financial services industry. He has also held various leadership positions at PwC including leader of the Central Region’s consumer and industrial products business segment and managing partner of their St. Louis practice. He is currently a member of the Board of Directors of Mercy Health East Communities and Webster University.Communities. Mr. Swyers holds the Certified Public Accountant designation. Mr. Swyers has an extensive audit and accounting background and is recognized as a financial expert. His knowledge in these areas assists the Board in its oversight responsibilities. |
| | | | 10 | | 2018 Proxy Statement • Proposals and Company Information |
| | | | | | | | |  
| | Marita Zuraitis Age: 5557 Director Since: 2013 Horace Mann Committees: Customer Experience & Technology Executive Investment & Finance | | Ms. Zuraitis was appointed to her present position as President and Chief Executive Officer in September 2013. She joined the Company in May 2013 as President and Chief Executive Officer-Elect. Ms. Zuraitis joined Horace Mann from The Hanover Insurance Group where she was an Executive Vice President and a member of The Hanover’s Executive Leadership Team. From 2004 to 2013, she served as President, Property and Casualty Companies, responsible for the personal and commercial lines operations at Citizens Insurance Company of America, The Hanover Insurance Company and their affiliates. Prior to 2004, Ms. Zuraitis was with The St. Paul/Travelers Companies for six years, where she achieved the position of President and Chief Executive Officer, Commercial Lines. She also held a number of increasingly responsible underwriting and field management positions with United States Fidelity and Guaranty Company and Aetna Life and Casualty. She is a member of the Board of Directors of LL Global, Inc., a trade association with operating divisions LIMRA and LOMA, and a memberVice Chair of the Board of Trustees of The Institutes, the leading provider of risk management and property-casualty insurance education, whose offerings include the premier CPCU® designation.designation, and a past member of the Board of Directors of LL Global, Inc., a trade association with operating divisions LIMRA and LOMA. She is also a member of the Board of Directors of Citizens Financial Group, Inc. Ms. Zuraitis has over 30 years of experience in the insurance industry. Ms. Zuraitis’s knowledge of and extensive background in the insurance industry contribute to Board discussion and understanding of issues impacting the Company. |
All of the Board Nominees were elected Directors at the last Annual Meeting of Shareholders of the Company held on May 20, 2015,24, 2017, with the exception of Mr. Reece,Hines, who was identified by a retained executive search firm working with the Directors of the Company and recommended for nomination as a Director by the Company’s Nominating and Governance Committee. The Board recommends that Shareholders vote FOR the election of these nine nominees as Directors. | | | | 2018 Proxy Statement • Proposals and Company Information | | 11 |
Board of Directors and Committees There were nine members on the Board as of March 15, 2016.2018. The Board met fiveseven times during 2015.2017. No Director of the Company attended fewer than 75% of the Board meetings and the committee meetings to which he or she was appointed and served during 2015.2017. The Chairman of the Board presides over all executive sessions of the Board, including executive sessions ofnon-employee Directors, and may be contacted as described in “Corporate Governance - Communications with Directors”. The members of the Board are expected to be present at the Annual Meeting. The following nineeight Directors serving on the Board at the time of last year’s Annual | | | 6 | | 2016 Proxy Statement • Proposals and Company Information |
Meeting attended the meeting: Dr. Futrell, Mr. Hasenmiller, Mr. Helow, Ms. McClure, Mr. Shaheen,Reece, Mr. Steinbecker,Shaheen, Mr. Stricker, Mr. Swyers and Ms. Zuraitis. Committees of the Board The standing committees of the Board consist of the Executive Committee, Compensation Committee, Nominating & Governance Committee, Investment & Finance Committee and Audit Committee. Each standing committee is governed by a charter that defines its role and responsibilities which are available on the Company’s website at www.horacemann.com under “Investors - Corporate Overview - Committee-Committee Composition and Charters”. A printed copy of these charters may be obtained by Shareholders upon written request addressed to Investor Relations, Horace Mann Educators Corporation, 1 Horace Mann Plaza,C-120, Springfield, Illinois 62715-0001. The Board may also form ad hoc committees from time to time. TheExecutive Committee exercises certain powers of the Board during intervals between meetings of the Board and, as requested by the Chief Executive Officer, acts as a sounding board for discussing strategic and operating issues. TheCompensation Committee approves and recommends to the Board the compensation, salaries, bonuses and awards applicable to the Executive Officers and Directors of the Company and oversees the process of Executive Officer leadership development and succession. Each of the current members of this Committee is independent under the listing standards of the NYSE applicable to compensation committee members. The Compensation Committee receives recommendations from management and has unrestricted access to the Company’s personnel documents and to reports or evaluations of any independent compensation consultants, specialists or advisors who are retained by the Company or the Compensation Committee to analyze the compensation of the Executive Officers and members of the Board. The Compensation Committee also has access to any other resources which it needs to discharge its responsibilities, including selecting, retaining and/or replacing, as needed, compensation consultants and other outside consultants to provide independent advice to the Compensation Committee. Additional information regarding the processes and procedures for the consideration and determination of Executive Officer compensation is provided in the “Compensation Discussion and Analysis”. TheNominating & Governance Committee develops and recommends to the Board corporate governance principles applicable to the Company, oversees the Board succession planning process, and recommends Director candidates to the Board. The Nominating & Governance Committee will consider Director candidates recommended by Shareholders. Candidates may be submitted in writing to the Corporate Secretary, Horace Mann Educators Corporation, 1 Horace Mann Plaza, Springfield, Illinois 62715-0001. There are no differences between the evaluation of candidates recommended by Shareholders and the evaluation of candidates recommended by members of the Nominating & Governance Committee. The Committee evaluates possible nominees to the Board on the basis of the factors it deems relevant, including the following: high standards of personal character, conduct and integrity; | | | | 12 | | 2018 Proxy Statement • Proposals and Company Information |
an understanding of the interests of the Company’s Shareholders, clients, employees, agents, suppliers, communities and the general public; the intention and ability to act in the interest of all Shareholders; a position of leadership and substantial accomplishment in his or her field of endeavor, which may include business, government or academia; the ability to understand and exercise sound judgment on issues related to the goals of the Company; a willingness and ability to devote the time and effort required to serve effectively on the Board, including preparation for and attendance at Board and committee meetings; the absence of interests or affiliations that could give rise to a biased approach to directorship responsibilities and/or a conflict of interest, and the absence of any significant business relationship with the Company except for the employment relationship of an employee Director; and the needs of the Board, including skills, experience, diversity and age. TheInvestment & Finance Committee approves investment strategies, monitors the performance of investments made on behalf of the Company and its subsidiaries, and oversees issues and decisions relating to the Company’s capital structure. TheAudit Committee oversees the accounting and financial reporting process, audits of the financial statements, and internal operating controls of the Company. It meets with both the Company’s management and the Company’s independent registered public accounting firm. Each of the current members of this Committee is independent under the independence standards of the NYSE applicable to audit committee members. No Audit Committee member serves on the audit committee of more than three other publicly traded companies. The Board has determined that Mr. Swyers, the Chair of our Audit Committee, is a financial expert. Mr. Swyers retired in 2013 from PricewaterhouseCoopers LLP, a public accounting firm, after a 40 year career where he served as the lead engagement partner on many national and international companies, including those in the financial services industry. He also held various leadership positions including leader of the Central Region’s consumer and industrial products business segment and managing partner of their St. Louis practice. TheCustomer Experience & Technology Committeeis an ad hoc committee formed by the Board during 2013. The Committee oversees the Company’s goals and strategies related to improving and managing the customer experience, as well as the development and implementation of the Company’s technology strategies. | | | 20162018 Proxy Statement • Proposals and Company Information | | 713 |
The following table identifies membership and the Chairman of each of the current committees of the Board, as well as the number of times each committee met during 2015.2017. | | | | | | | | | | | | | | | | | Director | | Executive
Committee | | Compensation Committee | | Nominating & Governance
Committee | | Investment & Finance
Committee | | Audit
Committee | | Customer
Experience & Technology
Committee (1) | | Executive
Committee | | Compensation Committee | | Nominating & Governance
Committee | | Investment & Finance
Committee | | Audit
Committee | | Customer
Experience & Technology
Committee (1) | | | | | | | | | | Daniel A. Domenech | | | | | | | | X | | | | X | | | | | | X | | | | | | X | Mary H. Futrell | | | | X | | X | | | | | | X | | | | | | | | | | | Stephen J. Hasenmiller | | X | | Chair | | X | | | | | | | | X | | Chair | | | | | | X | | | | | | | | | | | | Ronald J. Helow | | X | | | | | | | | X | | Chair | | X | | | | X | | | | | | Chair | | | | | | | | | | Beverley J. McClure | | | | X | | | | | | X | | X | | | | X | | | | | | X | | X | | | | | | | | | | H. Wade Reece | | | | | | | X | | X | | | | X | | | | | | | | | | Gabriel L. Shaheen | | Chair | | X | | Chair | | | | | | | | Chair | | X | | Chair | | | | | | | | | | | | | | | | Robert Stricker | | | | | | | | Chair | | X | | X | | | | | | | | Chair | | | | X | | | | | | | | | | Steven O. Swyers | | | | | | | | X | | Chair | | | | | | | | | | X | | Chair | | | | | | | | | | | | Marita Zuraitis | | X | | | | | | X | | | | X | | X | | | | | | X | | | | X | Meetings in 2015 | | 0 | | 5 | | 4 | | 4 | | 12 | | 4 | | | | | | | | | | | | Meetings in 2017 | | | 0 | | 5 | | 4 | | 4 | | 12 | | 4 |
Chair - Committee Chair X - Committee member | (1) | The Customer Experience & Technology Committee is an ad hoc committee. |
| | | | 14 | | 2018 Proxy Statement • Proposals and Company Information |
Director Compensation The compensation program fornon-employee Directors is shown in the following table: | | | | | Compensation Element | | Non-Employee Director Compensation (1)(2) | | | Board Chairman Annual Retainer | | $100,000 115,000 | | | Board Member Annual Retainer
(other than Board Chairman) | | $55,000 60,000 | | | Committee Chairman Annual Retainer | | $25,000 Audit Committee $15,000 Compensation Committee $12,000 Nominating & Governance Committee $15,000 Customer Experience & Technology Committee
$10,000 all other Committees15,000 Investment & Finance Committee $12,000 Nominating & Governance Committee | | | Committee Member Annual Retainer
(other than Committee Chairman) | | $10,000 Audit Committee $ 7,500 all other Committees (3) | | | Share-based Compensation | | Fair value on the date of the respective awards is used to determine the number of Restricted Stock Units (“RSUs”) awarded. An annual award of $90,000$95,000 in RSUs following the Annual Shareholder Meeting. $90,000$95,000 in RSUs if joining the Board within 6 months after the prior Annual Shareholder Meeting, $45,000$47,500 in RSUs if joining more than 6 months after the prior Annual Shareholder Meeting but before the next Annual Shareholder Meeting. All awards have a 1 year vesting period. | | | Basic Group Term Life Insurance | | Premium for $10,000 face amount | | | Business Travel Accident Insurance | | Premium for $100,000 coverage |
| (1) | Annual retainer fees are paid following the Annual Shareholder Meeting each year. The annual retainer fees are prorated to the extent that anon-employee Director joins the Board after the Annual Shareholder Meeting. |
| (2) | Non-employee Directors may elect to defer cash compensation into Common Stock equivalent units (“CSUs”). RSUs. |
| (3) | All other Committees except for the Executive Committee which is not paid an Annual Retainer. |
| | | Non-employee Directors are required to hold shares of HMEC Common Stock with a book value equal to five times their annual cash retainer. | | |
Untilnon-employee Directors meet this ownership requirement, they must retain all Common Stock equivalent units and Restricted Stock UnitsRSUs granted as share-based compensation (net of taxes). All As of December 31, 2017, allnon-employee Directors have met the guidelines with the exception of Mr. Swyers, who joined the Board in 2014, and Dr. Domenech,Mr. Reece, who joined the Board in 2015, and they2016. They have 5 years to meet this requirement. Employee Directors do not receive compensation for serving on the Board and are subject to separate stock ownership guidelines. See “Compensation Discussion and Analysis - Stock–Stock Ownership and Holding Requirements”. | | | 8 | | 20162018 Proxy Statement • Proposals and Company Information | | 15 |
The following table sets forth information regarding compensation earned by, or paid to, thenon-employee Directors during 2015:2017: | | | | | | | | | | | | | | | Director | | Fees Earned
or Paid in Cash ($) | | | Stock Awards
($) (1) | | | All Other
Compensation
($) (2) | | | Total
($) | | | Fees Earned
or Paid in Cash ($) | | Stock Awards
($) (1) | | All Other
Compensation
($) (2) | | | Total
($) | | | | | | | Daniel A. Domenech | | | 0 | | | | 160,000 | | | | 102 | | | | 160,102 | | | 0 | | | 170,000 | | | 204 | | | | 170,204 | | Mary H. Futrell | | | 38,750 | | | | 128,750 | | | | 204 | | | | 167,704 | | | | | | | | Stephen J. Hasenmiller | | | 85,000 | | | | 90,000 | | | | 204 | | | | 175,204 | | | 85,000 | | | 95,000 | | | 204 | | | | 180,204 | | | | | | | Ronald J. Helow | | | 87,500 | | | | 90,000 | | | | 204 | | | | 177,704 | | | 82,500 | | | 95,000 | | | 204 | | | | 177,704 | | | | | | | Beverley J. McClure | | | 80,000 | | | | 90,000 | | | | 51 | | | | 170,051 | | | 85,000 | | | 95,000 | | | 51 | | | | 180,051 | | | | | | | H. Wade Reece | | | 82,500 | | | 95,000 | | | 51 | | | | 177,551 | | | | | | | Gabriel L. Shaheen | | | 129,500 | | | | 90,000 | | | | 51 | | | | 219,551 | | | 134,500 | | | 95,000 | | | 51 | | | | 229,551 | | | | | | | Robert Stricker | | | 82,500 | | | | 90,000 | | | | 204 | | | | 172,704 | | | 82,500 | | | 95,000 | | | 204 | | | | 177,704 | | | | | | | Steven O. Swyers | | | 87,500 | | | | 90,000 | | | | 204 | | | | 177,704 | | | 92,500 | | | 95,000 | | | 204 | | | | 187,704 | |
| (1) | Represents fees deferred in 20152017 pursuant to the HMEC 2010 Comprehensive Executive Compensation Plan, as well as $90,000$95,000 in RSUs (awarded May 20, 2015)24, 2017). As of December 31, 2015,2017, each Director had 2,6022,538 unvested RSUs. |
| (2) | Represents insurance premiums provided by the Company for group term life insurance and business travel accident insurance for each Director. The group term life insurance premiums areage-banded and this is reflected in the lower premiums for Ms. McClure, Mr. Reece and Mr. Shaheen. In addition, Dr. Domenech’s premiums were pro-rated based on the date that he joined the Board. |
Corporate Governance Director Independence The Company’s Corporate Governance Principles require that the Board consist of a majority of directors who meet the criteria for independence required by the listing standards of the NYSE. Based on the independence requirements of the NYSE and after reviewing any relationships between the Directors and the Company or its management (either directly or indirectly, including as a partner, shareholder or officer of an organization that has a relationship with the Company or its management) that could impair, or appear to impair, the Director’s ability to make independent judgments, the Board determined that none of itsnon-employee Directors have a material relationship with the Company, and therefore all of these Directors are independent. In addition, the Board determined that Mr. Reece does not have a material relationship with the Company, and therefore is independent. These independence determinations are analyzed at least annually in both fact and appearance to promote arms-length oversight. The currentnon-employee Directors are Dr. Domenech, Dr. Futrell, Mr. Hasenmiller, Mr. Helow, Ms. McClure, Mr. Reece, Mr. Shaheen, Mr. Stricker and Mr. Swyers. Board Leadership Structure The Board is committed to strong, independent Board leadership and believes that objective oversight of management is a critical aspect of effective corporate governance. Accordingly, the Board currently has two separate individuals holding the offices of Chairman and Chief Executive Officer, and the position of Chairman is held by an independent Director. The Board of Directors believes that having an independent Director serve as Chairman is in the best interest of the Company at this time as this structure provides a greater role for the independent Directors in the oversight of the Company. However, as described in the Company’s Corporate Governance Principles, this situation can change in the future to permit one individual to hold both positions, if the Board deems it to be in the best interests of the Company at a given time. Board’s Role in Risk Oversight The Board of Directors is responsible for overseeing the processes that management has established for assessing and managing risk. In addition, the Board has delegated oversight of certain categories of risk to designated Board committees. In performing their oversight responsibilities, the Board and relevant committees regularly discuss with management the Company’s policies with respect to risk | | | | 16 | | 2018 Proxy Statement • Proposals and Company Information |
assessment and risk management. The committees report to the Board regularly on matters relating to the specific areas of risk the committees oversee. In addition, the Company has established an internal Enterprise Risk Management (“ERM”) Committee, which is composed of certain members of senior management including the President and Chief Executive Officer; the Executive Vice President and Chief Financial Officer; the Executive Vice President, Annuity and Life; the Executive Vice President, Property & Casualty; the Senior Vice President and Chief Human Resources Officer; the Senior Vice President, Field Operations and Distribution; the Senior Vice President and Chief Information Officer; the General Counsel and Chief Compliance Officer; and the Corporate Secretary.heads of Field Operations and Distribution, Business Development and the Life & Retirement and Property & Casualty divisions. The ERM Committee is chaired by the Executive Vice President and Chief Financial Officer of the Company. Throughout the year, the Board and the relevant Board committees receive regular reports from the Enterprise Risk ManagementERM Committee and its chairman regarding major risks and exposures facing the Company and the steps management has taken to monitor and control such risks and exposures. In addition, throughout the year, the Board and the relevant Board committees dedicate a portion of their meetings to review and discuss specific risk topics in greater detail. Also, in light of ongoing threats to corporate cybersecurity, the Board and relevant Board Committees receive regular reports from the Chief Information Officer of the Company regarding cybersecurity risks and the steps management has taken to monitor and control such risks. The Audit Committee dedicates a portion of their meetings to review and discuss the Company’s cybersecurity program. | | | 2016 Proxy Statement • Proposals and Company Information | | 9 |
Code of Ethics, Code of Conduct and Corporate Governance Principles The Company has adopted a Code of Ethics and a Code of Conduct applicable to all employees, including the Chief Executive Officer, Chief Financial Officer, Controller and Directors (in their capacity as Directors of the Company). The Company has also adopted Corporate Governance Principles. The Codes and Principles are available on the Company’s website at www.horacemann.com, under “Investors - Corporate Overview - Governance Documents”.Documents.” A printed copy of the Codes and Principles may be obtained by Shareholders upon written request, addressed to Investor Relations, Horace Mann Educators Corporation, 1 Horace Mann Plaza,C-120, Springfield, Illinois 62715-0001. Corporate Social Responsibility Horace Mann works hard to be a responsible corporate citizen, and is guided by its high standards and mission to serve educators across the country. Horace Mann’s Corporate Social Responsibility Report provides anin-depth view of the ways in which Horace Mann has a positive impact on its customers, employees, Shareholders and the communities in which Horace Mann does business. The Board encourages Shareholders to review the Corporate Social Responsibility Report which is available on the Company’s website at www.horacemann.com, under “Investors - Corporate Overview - Corporate Social Responsibility.” Director Education Each Director is required to participate in at least one education program every two years and may choose to participate in up to two education programs in a two yeartwo-year period at the Company’s expense. All Directors are in compliance with this requirement. Communications with Directors The Company has established various processes to facilitate communications with the Board by Shareholders and other interested parties. Communications tonon-employee Directors as a group or to the Chairman of the Board or to an individual Director may be submitted via regular mail addressed to the Board of Directors, c/o the Corporate Secretary, Horace Mann Educators Corporation, 1 Horace Mann Plaza, Springfield, Illinois 62715-0001. Additionally, communications may be emailed to the Board of Directors, c/o the Corporate Secretary at hmecbofd@horacemann.com. Compensation Committee Interlocks and Insider Participation There are no Compensation Committee interlocks between the Company and other entities involving the Company’s Executive Officers and Directors who serve as executive | | | | 2018 Proxy Statement • Proposals and Company Information | | 17 |
officers or directors of such other entities. During 2015,2017, no member of the Compensation Committee was a current or former officer or employee of the Company. Review, Approval or Ratification of Transactions with Related Persons The Board reviews issues involving potential conflicts of interest of its members and is responsible for reviewing and approving all related party transactions. The Board does not have a formal related party transaction policy but it considers each related party transaction individually. Related Person Transactions BlackRock, Inc. (“BlackRock”), which owns beneficially more than 5% of the issued and outstanding shares of Common Stock, provides investment risk management services to the Company and has done so for more than 10 years. In 2015,2017, the Company paid approximately $0.5 million$524,809 in fees to BlackRock associated with the Company’s use of analytical software owned by BlackRock. Other than the BlackRock relationship, the Company does not have any contracts or other transactions with related parties that are required to be reported under the applicable securities laws and regulations. PROPOSAL NO. 2 - ADVISORY RESOLUTION TO APPROVE NAMED EXECUTIVE OFFICERS’ COMPENSATION The Board is asking Shareholders to approve an advisory resolution to approve the compensation of the Company’s NamedChief Executive Officer, Chief Financial Officer and the other three highest compensated Executive Officers (“NEOs”employed at the end of 2017 (collectively the “Named Executive Officers” or “NEOs”) as reported in this Proxy Statement. The Compensation Committee has structured our NEOs’ compensation program as described below under “Compensation Discussion and Analysis”.Analysis.” The Board recommends that Shareholders read the “Compensation Discussion and Analysis” (“CD&A”) included in this Proxy Statement, which describes in more detail how our Executive Compensation policies and procedures operate and are designed to achieve our compensation objectives, as well as the “Summary Compensation Table” and other related compensation tables and narrative included within the CD&A, which provide detailed information on the compensation of our NEOs. The Compensation Committee and the Board of Directors believe that the policies and procedures articulated in the CD&A are effective in achieving our goals. In accordance with Section 14(a) of the Securities Exchange Act, and as a matter of good corporate governance, the Board is asking Shareholders to approve the following advisory resolution at the 20162018 Annual Meeting: RESOLVED, that the Shareholders of Horace Mann Educators Corporation (the Company) approve, on an advisory basis, the compensation of the Company’s Named Executive Officers disclosed in the Compensation Discussion and Analysis, the Summary Compensation Table and the related compensation tables, notes and narrative in the Proxy Statement for the Company’s 20162018 Annual Meeting of Shareholders. This advisory resolution, commonly referred to as a “Say on Pay” resolution, isnon-binding on the Board of Directors. Althoughnon-binding, the Board and the Compensation Committee will review and consider the voting results when making future decisions regarding our NEOs’ compensation program. The Board has adopted a policy providing for an annual advisory vote to approve NEOs’ compensation. Unless the Board modifies its policy on the frequency of holding such advisory votes, the next advisory vote will occur at the Company’s 20172019 Annual Meeting of Shareholders. The Board recommends that Shareholders vote FOR the approval of the advisory resolution to approve Named Executive Officers’ compensation. | | | 1018 | | 20162018 Proxy Statement • Proposals and Company Information |
Compensation Discussion and Analysis | | | | | In this section, we describe the material components of our executive compensation program for our Named Executive Officers, or “NEOs,”NEOs, whose compensation is displayed in the 20152017 Summary Compensation Table and the other compensation tables contained in this Proxy Statement. We also provide an overview of our executive compensation philosophy and we explain how and why the Compensation Committee of our Board (the “Committee”) arrives at specific compensation policies and decisions. Our 20152017 NEOs are our Chief Executive Officer (“CEO”), Chief Financial Officer (“CFO”) and the three other most highly compensated Executive Officers employed at the end of 2015:2017: Marita Zuraitis, President and Chief Executive Officer;CEO; Dwayne D. Hallman,Bret A. Conklin, Executive Vice President and Chief Financial Officer;CFO*;
Matthew P. Sharpe, Executive Vice President, AnnuityLife & Retirement and Life;Business Development; William J. Caldwell, Executive Vice President, Property & Casualty and Casualty;Customer Engagement; and Kelly J. Stacy,Donald M. Carley, Senior Vice President, Field OperationsGeneral Counsel, Corporate Secretary, and Distribution.Chief Compliance Officer
*Note Regarding Chief Financial Officer On Feb. 3, 2017, our Executive Vice President and Chief Financial Officer, Dwayne D. Hallman, passed away. Bret A. Conklin was named Acting CFO on January 30, 2017, and was named Executive Vice President and Chief Financial Officer on April 13, 2017. Because Mr. Conklin was our CFO for the majority of 2017, we will include the compensation and pay decisions made with respect to him when discussing the compensation of our NEOs throughout this section. Compensation for Mr. Hallman is included in the 2017 Summary Compensation Table and other compensation tables contained in this Proxy Statement. We believe that this approach provides our Shareholders with a representative view of our pay programs with respect to our NEOs. | | |
Executive Summary This summary highlights information from this Compensation Discussion and Analysis section and may not contain all the information that is necessary to gain a full understanding of our policies and decisions. Please read the entire Compensation Discussion and Analysis section and compensation tables for a more complete understanding of our compensation program. Our Business We are a personal insurance and financial services business with approximately $10.1$11.2 billion of assets and approximately $1.2 billion in total revenue as of December 31, 2015.2017.Founded by Educators for Educators®, we offer our products and services primarily toK-12 teachers, administrators, and other employees of public schoolsschool employees and their families. We underwrite personal lines of auto, property and life insurance, andas well as retirement annuitiesproducts in the United States of America.States. 2015
| | | | 2018 Proxy Statement • Compensation Discussion and Analysis | | 19 |
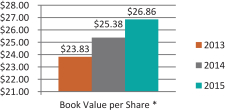
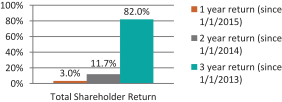
2017 Business Highlights The Company delivered solid underlying financial results across all three segments of its multiline insurance platformbusiness in 2015.2017. Full year Operating Income was $2.00core earnings were $1.74 per diluted share. Book value per share* increased 6%6.2% in 20152017 driven by the solid operating results and positive contributions from investment portfolio performance.performance as well as the benefit related to the passage of the Tax Cuts and Jobs Act of 2017. In addition, we achieved broad-based increases in new business sales and solid policy retentions were achieved during the past year. Total Shareholder Return was 3.0%5.9% in 2015.2017 underperforming key insurance and general market indices that the Company outperformed the prior year. 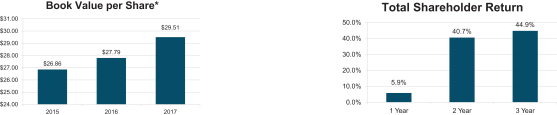
* | Excluding the fair value adjustment for investments and including, for 2017, a $1.20 benefit related to the passage of the Tax Cuts and Jobs Act of 2017. |
These results reflect significant progress on numerous strategic initiatives, including: | • | | Increased sales levels year-over-year in all lines of business excluding life
New auto and property sales premium increased 5% and 4%, respectively Strong auto and property retention ratios Retirement deposits(fee-based and spread-based) comparable to the prior year Annuity assets under management increased by 9% Double digit growth in Life sales (13.5%) Solid earnings contribution from Life and Retirement P&C earnings impacted by significant adverse weather/catastrophes - Achieved 1 point of underlying auto combined ratio improvement - Property reported combined ratio of 97.0 despite record catastrophes |
| • | | New auto sales premium increased 7%
|
| • | | Auto policy-in-force growth of 1.2%
|
| • | | Horace Mann agency annuity sales increased 8% including the new fixed indexed annuity product
|
| • | | Strong auto and property retention ratios
|
| • | | Improved profitability in the underlying Property and Casualty book of business
|
| • | | Increased annuity assets under management by 5%
|
| • | | Introduction of new indexed universal life product
|
Please see “Management’s Discussion and Analysis of Financial Condition and Results of Operations” in HMEC’s 20152017 Annual Report on andForm 10-K for a more detailed description of these financial results. | | | 201620 | | 2018 Proxy Statement • Compensation Discussion and Analysis | | 11 |
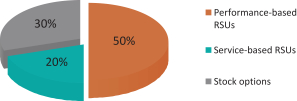
2017 Executive Compensation Highlights of Pay Practice and Governance | | | | | These elements of the executive compensation program are described more fully below. • Balanced pay Pay mix comprised of Base Salary,base salary, cash annual incentives under the Annual Incentive Plan (“AIP”), and equity-based long-term incentives under the Long-term Equity Incentive Awards, and Annual Cash IncentivesPlan (“LTIP”) • Over 70% of the CEO’s target compensation and over 56%60% of all other NEOs’ target compensation is linked to performance and service-basedperformance-based and/or equity-based incentives and is at risk • Balanced performance measures designed with a focus on shareholder return, both absolute and relative, and incenting profitableoperating growth while managing risk • Performance incentives tied to multiple overlapping performance periods • Annual cash incentives tied to Company and business line performance measures • Long-term incentives entirely equity-based: • Annual Incentive Plan tied to absolute performance measures
• Long-term Incentive Plan had been tied to all relative performance measures until the introduction of an absolute growth measure in 2015
• Long-term Incentives are entirely equity based
Ø Service-based stock options with a 4-year vesting period
Ø➣ Performance-based RSUs vest following a3-year performance period, based on relative measures (relative total shareholder return and relative operating return on equity) and an absolute total written premium growth measure
Ø➣ Service-based RSUsService-vested stock options with a 3-year4-year vesting period
•➣ Service-vested RSUs with a3-year vesting period
• Stock Ownership Requirementsownership guidelines for NEOs (500% of salary for CEO, 350% of salary for other NEOs) and a 12-month ➣ Twelve-month post-exercise holding requirement onfor stock options • Clawback Policypolicy applicable to both cash and equity awards • Executive Change In Control plan excludes “taxgross-up” provision • Executive Change in Control Plan excludes “tax gross-up” provisions Limited perks and executive benefits | | |
Pay PracticeGovernance Oversight The Committee oversees our executive compensation program. The current members of the Committee are Mr. Hasenmiller, Ms. McClure, and Mr. Shaheen. Mr. Hasenmiller serves as the Committee Chair. Consistent with the listing standards of the NYSE, the Committee is composed entirely of independent Directors. The Committee retained Compensation Advisory Partners LLC (“CAP”) as independent compensation consultants. CAP provides information and advice on the competitive market for executive talent, evolving market practices in our industry and the general employment market, regulatory and other external developments, and our executive compensation philosophy and incentive program design. In this way, CAP assists the Committee with ongoing education. Also, Committee members comply with Directors’ education requirement to help ensure each remains up to date on current issues relevant to the Company and its business. The CAP consultants report directly to the Committee, attend the Committee meetings and portions of executive sessions of the Committee at the Chair’s request (generally with the Board’s outside legal counsel, but without management present). CAP serves at the pleasure of the Committee, and performs no services for management. CAP works with management to obtain necessary data and perspectives on the Company’s strategic objectives, business environment, corporate culture, performance, and other relevant factors. This information is used by CAP to formulate its recommendations related to competitive compensation performance targets and overall design. CAP’s findings and recommendations are reported directly to the Committee. The services provided by CAP during 2017 are described in more detail throughout this CD&A. Pursuant to regulatory requirements, the Committee assessed CAP’s independence (along with that of its other direct and indirect | | | | 2018 Proxy Statement • Compensation Discussion and Analysis | | 21 |
consultants and advisors) in 2017 and concluded that CAP’s work did not raise any conflicts of interest. In addition, the Committee has the authority to hire other experts and advisors as it deems necessary. Management also supports the Committee by providing analysis and recommendations. When setting levels of executive compensation, the Committee requests, receives, and considers the recommendations of the CEO regarding the performance of her direct reports and other Executive Officers. Members of management also attend and contribute to Committee meetings as relevant to the Committee agenda. The Committee discusses its fundamental views on compensation and guiding principles, as well as its expectations of the CEO’s performance and annual goals, with the CEO and subsequently proposes the CEO’s goals to the Board for approval. The Committee does not include the CEO or other members of management in its discussions with CAP on the CEO’s compensation, nor does the CEO or management participate in the Committee’s recommendation to the Board on the CEO’s compensation. Say on Pay At the 2017 Annual Meeting of Shareholders, 70.3% of Shareholders voted, on an advisory basis, to ratify the NEOs’ compensation. This “Say on Pay” advisory vote reflected a significant decrease from the near-unanimous Shareholder support received from the 2011 through 2016 “Say on Pay” advisory votes (average of 97% in favor). The percentage of Shareholders who voted in favor of the 2017 NEO compensation was lower than the Committee and Board desired. Accordingly, we wanted to provide our Shareholders with additional information and context on how we are addressing the reduced 2017 affirmative “Say on Pay” advisory vote. We take this decline in our “Say on Pay” advisory vote seriously. Fundamentally, our goal is to link our executive compensation programs to long-term value creation and we believe we have had a long-standing record of accomplishing this goal. In response to the 2017 “Say on Pay” advisory vote and at the direction of the Committee, Company management solicited, and received, feedback from certain proxy advisory firms regarding the 2017 NEO compensation. In addition, through regular Shareholder outreach, Company management provided the opportunity for feedback regarding the 2017 “Say on Pay” advisory vote. Shareholders and proxy advisory firms were generally supportive of the Company’s overall compensation program in 2017. However, one advisory firm expressed a concern with executive compensation, based fundamentally onone-time strategic incentive grants provided to our NEOs in 2016, and recommended that the Company disclose threshold performance levels under the AIP and LTIP. Based on the feedback we received, we are making several changes and including additional disclosure in our CD&A. First, in an effort to ensure the Company’s executive compensation practices are closely aligned with the expectations of our Shareholders and provide additional insight to both our Shareholders and proxy advisory firms, the Committee is disclosing, annually, the peer group it considers when making executive compensation decisions. (See “Compensation levels should be market competitive” below for additional information). Second, the strategic incentive grants, which were described in depth in both the 2016 and 2017 Proxy statements, were designed to incentivize the achievement of both corporate financial goals and strategic individual goals in order to promote continuity of leadership as the Company pursues its long-term vision, and also strengthen management’s alignment with Shareholder interest. These awards were specifically designed to address key priorities during the Company’s strategic evolution, and are not an ongoing component of our executive compensation program. If the management team is successful in achieving these specific strategic objectives, the Committee believes it will drive incremental value for Shareholders. | | | | 22 | | 2018 Proxy Statement • Compensation Discussion and Analysis |
Third, threshold, target, and maximum performance levels for our 2017 AIP and 2015-2017 LTIP are discussed in more detail in the “Annual Incentive Plan” and “2015-2017 PBRSUs” sections below. For our 2018 Proxy, we are disclosing threshold levels for our AIP and LTIP. We consistently have disclosed, and will continue to disclose, our performance goals at the end of each respective performance cycle. The Committee continues to believe that the overall structure of our executive compensation plans, the absence of excessive perquisites, and our demonstratedpay-for-performance practices reflect the strength of the Company’s executive compensation programs. Frequency of “Say on Pay” Advisory Votes Pursuant to Section 14(a) of the Securities Exchange Act, the Board asked Shareholders to vote on the frequency of future “Say on Pay” advisory votes on NEOs’ compensation. Specifically, the Board asked whether “Say on Pay” advisory votes should occur every year, every two years or every three years. 76% of the Shareholder votes cast were in favor of annual “Say on Pay” advisory votes. The next vote on the frequency of future “Say on Pay” advisory votes will be conducted in 2023. Executive Compensation Program Guiding Principles The Committee has established a set of core principles that underlie our executive compensation program. These core principles provide guidance to the Committee and management in making decisions while administering the program or when considering changes. These core principles include strong alignment between pay and performance, incentive to drive Shareholder value, and market competiveness. Strong Paypay for Performanceperformance alignment We target compensation around the median of the competitive market, with executives earning more or less than median, generally based on the performance of the Company and value delivered to Shareholders. The overallOur core executive compensation program includes base salary, an annual cash incentive plan under the AIP, and long-term equity awards under the LTIP. Both the AIP and annual cash incentives.LTIP are administered under the Shareholder-approved 2010 Comprehensive Executive Compensation Plan, as amended (“CECP”). Incentive awards are earned upon the achievement of short-term and long-term business goals that are reviewed and approved by the Committee at the beginning of each performance period. Performance goals are structured to reward for business growth, profitability, and profitability,relative total shareholder return, balanced with productivity and risk and capital management. Executive interests should be aligned with Shareholders’ To encourage executive performance on a long-term basis, the Committee grants equity awards with multi-year performance periods and multi-year vesting. In 2017, Ms. Zuraitis received approximately 48% of her target compensation in equity. With respect to the other NEOs, approximately 37% to 46% of their compensation was equity-based. Incentive compensation should drive long-term value creation and reward strong performance The AIP performance goals are based on premiums and adjusted operating income to reward strong performance. The LTIP performance goals are directly linked to multi-year growth and return measures to keep executives focused on value creation. A significant portion of compensation should be “at risk” based on the Company’s performance For 2017, over 70% of the CEO’s target total pay (base salary, target annual incentive, and target long-term incentive) and over 60% of target total pay for all other NEOs is at risk, and is variable from year to year, and for much of it, the level of payout is dependent on the Company’s performance. | | | | 2018 Proxy Statement • Compensation Discussion and Analysis | | 23 |
Compensation levels should be market competitive The Committee sets total direct compensation for the NEOs – salary and target annual and long-term incentive opportunities – within a reasonable range of the median of the competitive market, while providing the ability to decrease or increase compensation if warranted by performance and experience. To determine competitive pay levels, we use an established peer group of similarly sized insurance companies in the Russell 2000® Index. The Committee worked with CAP to select our peer insurance companies for 2017, based upon assets under management and revenue. The peer group includes the property and casualty, life and health, and multi-line insurance companies charted below. The peer group does not include reinsurance or insurance brokers. We supplement this information with survey market data from published sources including LOMA, Towers Watson, and Mercer. The data from these surveys is scaled to our size by CAP based on revenues or asset ranges. Annually, CAP provides the Committee with a comparison of the base salary, annual incentives and long-term incentives of the CEO with those of other Chief Executive Officers based on the peer group and survey data obtained. The Committee does not seek to benchmark or set executive compensation at any specific level relative to the peer group. Instead, the Committee uses this information primarily as a general reference point for seeking to determine pay levels and forms of plan design that effectively recognize favorable executive performance and experience, and ensure executive retention. For 2017, CAP’s analysis demonstrated that Ms. Zuraitis’s overall core total direct compensation was consistent with target pay positioning at the median of the market. The other NEOs are assessed against comparable functional matches in the insurance industry and the broader general industry, as appropriate. Based on the data received, and CAP’s analysis, the Committee deliberates in executive session to determine its recommendation for approval by the Board. | | | | | 2017 Peer Group | | | | Ambac Financial Group | | Kemper Corporation | | RLI | | | | American Equity Investment Life | | MBIA | | Selective Insurance Group | | | | Argo Group International | | National General Holdings | | State Auto | | | | CNO Financial Group | | National Western Life Group | | The Navigators | | | | Employers Holdings | | One Beacon Insurance | | United Fire Group | | | | FBL Financial Group | | Primerica | | |
| | | | 24 | | 2018 Proxy Statement • Compensation Discussion and Analysis |
Compensation Mix Our NEOs’ annual compensation consists of base salary, annual incentives and long-term incentives. The targeted compensation mix of total direct compensation for the NEOs for 2017 is illustrated below. The mix of 2017 actual compensation varied as a result of actual incentives earned. 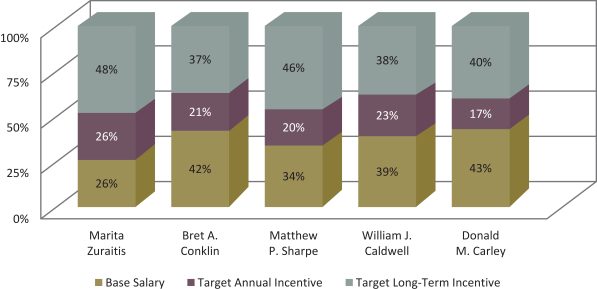
Base Salary Competitive base salaries are critical to attracting and retaining high performing executive talent. The Committee seeks to pay salaries that approximate median salaries for executives of similar companies in like positions. However, in recruiting new executives, we sometimes exceed these guidelines to attract qualified candidates. There may also be instances where an existing executive’s compensation deviates from the median, up or down, due to experience, performance, responsibilities, compensation history, internal equity, or retention risk. Salaries for the NEOs and other executive officers are reviewed every 12 months in connection with the review of financial results for the prior fiscal year and the annual performance review discussed under “Annual Performance and Pay Review” below. In 2017, Ms. Zuraitis, Mr. Sharpe, and Mr. Caldwell received base salary increases to move overall compensation closer to the market median. Mr. Conklin received a base salary increase to recognize his promotion to EVP and CFO. Mr. Carley did not receive a base salary increase in 2017. Base salary adjustments for 2017 are shown in the chart below. | | | | | | | | | | | | Named Individual | | 2016
Annualized
Salary | | | 2017
Annualized
Salary | | | Percent
Increase | Marita Zuraitis | | | $800,000 | | | | $850,000 | | | 6.3% | Bret A. Conklin | | | $275,000 | | | | $320,000 | | | 16.4% | Matthew P. Sharpe | | | $400,000 | | | | $415,000 | | | 3.8% | William J. Caldwell | | | $350,000 | | | | $375,000 | | | 7.1% | Donald M. Carley | | | $300,000 | | | | $300,000 | | | 0.0% |
| | | | 2018 Proxy Statement • Compensation Discussion and Analysis | | 25 |
Annual Incentive Plan Our AIP is a cash incentive plan, administered under the CECP, and designed to drive and reward strong performance over aone-year period. Annually, the Committee establishes the performance objectives, threshold, target and maximum performance levels, and the related threshold, target and maximum AIP opportunities for each NEO, expressed as a percentage of base salary. Target incentive opportunity levels for the NEOs are intended to approximate the median of the target bonus potential for similarly situated executives in comparable companies. Maximum incentive opportunities are set at 200% of target. For 2017, there were four performance measures, with 50% of the award based on Company-wide net operating income, and the remaining 50% divided among specific sales and premiums of the different business lines: P&C net written premium (20%), retirement sales (20%), and life sales (10%), as shown in the chart below. This provides a balance between shareholder return and growth, while complementing the longer-term LTIP metrics, which focus on long-term shareholder value creation. 2017 Annual Incentive Plan Performance Measures | | | 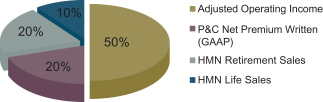 | | Adjusted Operating Income - Operating income (GAAP net income after tax, excluding realized investment gains and losses other than those for Fixed Indexed Annuity related options and embedded derivatives) adjusted for P&C catastrophe costs different than the annual Plan, Annuity & Life deferred acquisition costs (“DAC”) unlocking and change in guaranteed minimum death benefit (“GMDB”) reserve due to capital gains and losses and market performance different than Plan, the impact on investment income of share repurchases different than Plan, and debt structure/costs including debt retirement different than Plan. P&C Net Premium Written (GAAP) - Amount charged for property and casualty policies issued during the year. (Portions of such amounts may be earned and included in financial reports over future periods.) Retirement Sales - The amount of new business from the sales of Horace Mann annuity products, from Horace Mann and independent agents, as measured by premiums and deposits to be collected over the 12 months following the sale. Life Sales - The amount of new Horace Mann individual life insurance products sold during the year, as measured by premiums and deposits to be collected over the 12 months following the sale. |
All the NEOs’ 2017 annual incentive amounts are based on the same corporate and business line objectives to promote cooperation. The targets for the operating income and sales or premium | | | | 26 | | 2018 Proxy Statement • Compensation Discussion and Analysis |
measures were based on a review of market conditions and expectations of other companies in the industry as well as our financial plan for 2017 (“2017 Plan”). The 2017 Plan was the basis of our 2017 earnings guidance, which was publicly disclosed in February 2017 in connection with our release of earnings for the year ended December 31, 2016. The Committee believes that tying the AIP to Company performance provides appropriate alignment for an executive’s compensation as it recognizes that the Company as a whole must perform well in order to deliver value to our Shareholders. Further, tying all the NEOs’ AIP awards to the performance of specific business lines incentivizes cooperation among the business line leaders. It is the goal of the Committee to establish measurements and targets that are reasonable, but not easily achieved. The measures and targets are discussed with the CEO, other NEOs, other members of the Board and CAP before they are set. Each March, the Committee certifies performance and determines AIP payouts for the prior year. Based on the 2017 results of 95.46% of target for Ms. Zuraitis and the other NEOs, the 2017 AIP payouts (paid in March 2018) were as follows: | | | | | | | | | | | | | | | | | | | | | | | | | | | | | | | | | | | | 2017 AIP Measures (in $M) | | Threshold | | Target | | Maximum | | Actual | | Results | | Weighting | | Payout | Adjusted Operating Income | | | | 77.9 | | | | | 83.8 | | | | | 92.5 | | | | | 87.2 | | | | | 139 | % | | | | 50 | % | | | | 69.48 | % | P&C Net Premium Written | | | | 651.7 | | | | | 662.7 | | | | | 673.7 | | | | | 662.8 | | | | | 101 | % | | | | 20 | % | | | | 20.18 | % | Horace Mann Retirement Sales | | | | 422.3 | | | | | 435.3 | | | | | 448.3 | | | | | 367.3 | | | | | 0 | % | | | | 20 | % | | | | 0.00 | % | Horace Mann Life Sales | | | | 17.6 | | | | | 18.5 | | | | | 19.4 | | | | | 17.74 | | | | | 58 | % | | | | 10 | % | | | | 5.80 | % | Total | | | | | | | | | | | | | | | | | | | | | | | | | | | | | 100 | % | | | | 95.46 | % |
| | | | | | | | Named Individual | | 2017 Target
AIP Opportunity1 | | 2017 Actual
AIP Payout | | 2017 Actual AIP Payout
as a % of Base Salary | Marita Zuraitis | | 100% | | $803,455 | | 94.52% | Bret A. Conklin | | 35%/50% | | $134,200 | | 41.94% | Matthew P. Sharpe | | 60% | | $236,264 | | 56.93% | William J. Caldwell | | 60% | | $212,398 | | 56.64% | Donald M. Carley | | 40% | | $114,552 | | 38.18% |
(1) Mr. Conklin’s Target AIP Opportunity was increased to 50% upon his promotion to EVP & CFO 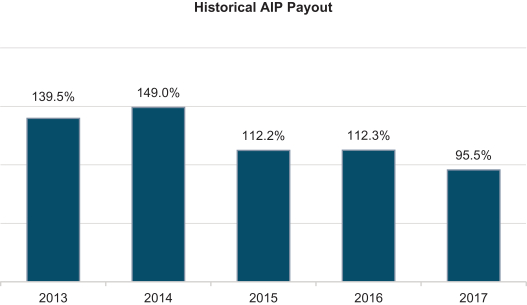
| | | | 2018 Proxy Statement • Compensation Discussion and Analysis | | 27 |
Long-term Incentive Plan Our Long-term IncentiveThe intent of our LTIP is comprisedto focus executives on shareholder value and key strategic objectives, while promoting retention.
2017 LTIP Aggregate Target Opportunity In setting the dollar values of three vehicles, performance-based RSUs, service-based RSUs and stock options,the 2017 opportunities under LTIP for each NEO, the Committee targeted amounts that would achieve the Company’s overall objective of positioning total compensation at approximately the market median. The 2017 target grant values for the NEOs were as described below. The performance-based RSUs provide an effective vehicle for rewarding executives based on a three-year performance period and have a high value in promoting executive retention. The performance-based RSUs, along with the service-based RSUs and stock options provide strong alignment with Shareholder interests and assist in the retention of key executive talent. Long-term Incentive Vehiclesfollows:
| | | | |  Named Individual | | 2017 LTIP
Target | | Marita Zuraitis | | | $1,550,000 | | Bret A. Conklin | | | $280,000 | | Matthew P. Sharpe | | | $565,000 | | William J. Caldwell | | | $360,000 | | Donald M. Carley | | | $285,000 | |
2017 LTIP Award Vehicles For 2017, LTIP is comprised of three vehicles, as illustrated in the chart below: (1) performance-based RSUs; (2) service-vested RSUs; and (3) service-vested stock options. | | | 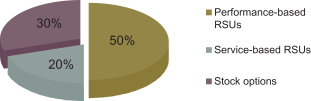 | | Performance-based RSUs - Earned over a three-year period, based upon Relative and Absolute Measures. If any shares are earned at the end of the three-year performance period, the executive fully vests in the award | | | Service-basedService-vested RSUs - Vest 1/ratably over 3 per year after years 1, 2 and 3
| | | Stock options - Granted at fair market value with a 10 year life; options vest ratably over 4 years |
Performance-Based RSUs (PBRSUs) | | | 12 | | 2016 Proxy Statement • Compensation Discussion and Analysis |
Long-term Incentive Plan Performance-based Measures
Our Long-term Incentive performance-based measures coverThe Committee believes that PBRSUs provide an effective vehicle for rewarding executives based on a three yearthree-year performance period. Each year, a new three yearthree-year period starts, partially overlapping the periods that started the prior two years. PBRSUs were granted on March 7, 2017 for the 2017-2019 performance period, and comprise 50% of the 2017 LTIP opportunity. These RSUs will be earned and vested on December 31, 2019, based on the level of achievement, though no RSUs will be earned if threshold level of performance is not achieved. From the date of grant, PBRSUs accrue dividend equivalents at the same rate as dividends paid to our shareholders, but the dividend equivalents are only paid on the corresponding shares that are earned. If no shares are earned, the dividend equivalents are forfeited. Earned dividend equivalents are converted into additional RSUs.
Service-vested RSUs The Committee may alterbelieves that service-vested RSUs assist in the performance measuresretention of key executive talent. Service-vested RSUs were granted on March 7, 2017 and comprise 20% of the 2017 LTIP opportunity. Service-vested RSUs vest 33% after the first year, vest an additional 33% after the second year and vest the final 34% after the third year from the grant date, and are subject to continued employment to the vesting date. From the date of the grant, the RSUs accrue dividend equivalents at the same rate as any new three year period starts. The performance measures adopted have been: 2013-2015 Performance-based RSU Measuresdividends paid to our Shareholders. These dividend equivalents are converted into additional RSUs and vest when the underlying RSUs vest.
| | | 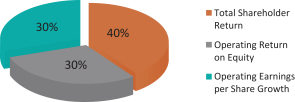 | | 2018 Proxy Statement • Compensation Discussion and Analysis |
Stock Options The Committee believes that stock options provide strong alignment with Shareholder interests, as executives do not realize any value unless our stock price appreciates. They also promote retention. Stock options granted under the LTIP have an exercise price equal to the closing stock price on the date of grant, vest ratably over a four-year period subject to continued employment on each vesting date and have aten-year term. Stock options were granted on March 7, 2017 and comprise 30% of the 2017 LTIP opportunity. Beginning with the 2017 LTIP grant, the Company transitioned from a blend of Incentive Stock Options (ISO) andNon-qualified Stock Options (NQSO) to all NQSOs. The number of options granted was determined using the Black-Scholes valuation method. For additional information regarding assumptions used for these valuations, see the Company’s 2017 Annual Report and Form10-K “Notes to Consolidated Financial Statements – Note 1 – Summary of Significant Accounting Policies – Share-Based Compensation.” Upon exercise Executive Officers are required to hold shares equivalent to any proceeds (net of exercise price and related taxes and the costs of the exercise) for a minimum of twelve months. Timing of Equity Grants The Committee has granted long-term incentives only at its regularly scheduled Board meetings. The grant date is the applicable resolution as approved or a future date as otherwise specified in the resolution. 2017-2019 Performance-based RSUs The Performance-based RSUs granted in 2017 have three performance measures as shown below: | | | 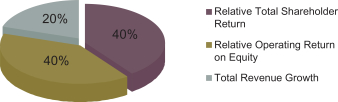 | | Relative Total Shareholder Return - Relates to theRelative Total Shareholder Return for the three-year period measured against a peer group of companiescompanies. Relative Operating Return on Equity - Relates to the averageAverage annual relative Operating Income return on average equity for the three-year period measured against a peer group of companiescompanies. Operating Earnings per Share Growth - Relates to the total percentage increase or decrease in Operating Earnings per share for the three-year period measured against a peer group of companies
|
2014-2016 Performance-based RSU Measures
| | | 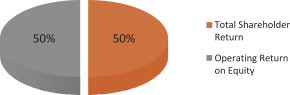 | | Total Shareholder ReturnRevenue Growth - RelatesMeasured as the CAGR over the period 12/31/2016 to the Total Shareholder Return12/31/2019 for the three-year period measured against a peer group of companies Operating Return on Equity - Relates to the average annual Operating Income return on average equityWritten Premium Growth for the three-year period measured against a peer group of companiesHMN auto, property, and life and total retirement sales for annuity (HMN, RIA and institutional platform) and HMGA.
|
Prior Years PBRSU Grants 2015-2017 Performance-based RSU Measures2016-2018 PBRSUs
The PBRSUs granted in 2016 will not mature until December 31, 2018. Since the applicable3-year performance period has not yet ended, actual performance against targets is not yet known. | | | 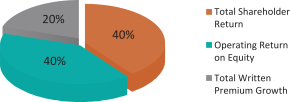 | | Total Shareholder Return - Relates to29
|
2015-2017 PBRSUs The performance-based RSUs granted in 2015 matured and vested as of December 31, 2017. The performance measures, targets and payout levels for the PBRSUs granted in 2015 are as follows: | | | | | | | | | | | | | | | | Measures | | Threshold (2) | | Target (2) | | Maximum (2) | | Weighting | | | Weighted Result
at 12/31/2017 | | Relative(1) Measures | | | | | | | | | | | | | | | TSR(3) | | 25th
Percentile
Ranking vs
Peer Co’s | | 50th
Percentile
Ranking vs
Peer Co’s | | 90th
Percentile
Ranking vs
Peer Co’s | | | 40% | | | | 46% | | Operating ROE(4) | | 25th
Percentile
Ranking vs
Peer Co’s | | 50th
Percentile
Ranking vs
Peer Co’s | | 90th
Percentile
Ranking vs
Peer Co’s | | | 40% | | | | 53% | | Absolute Measure | | | | | | | | | | | | | | | Total Written Premium Growth(5) | | 2% | | 3% | | 5% | | | 20% | | | | 19% | | | | | | | | | | | | | | | 118% | |
Notes: | (1) | Peer group comprised of Russell 2000 Index insurance companies excluding brokerage, reinsurance, financial guarantee, and health companies. |
| (2) | Threshold award (25th percentile) is 50% of target LTI opportunity; Target award (50th percentile) is 100%; Maximum (90th percentile) is 200% of target. Awards for results between Threshold-Target and Target-Maximum will be interpolated. |
| (3) | Total Shareholder Return for the three-year3 year period. Measures from the average price 5 trading days before and 5 trading days after the beginning of the measurement period measured against a peer group of companiesOperating Return on Equity - Relates(1/1/15) to the average price 5 trading days before and 5 trading days after the end of the measurement period (12/31/17). (Source: Bloomberg)
|
| (4) | Average annual Operating Income returnReturn on average equityAverage Equity (excluding FAS 115) for the three-year period measured against a peer group of companies3 years. (Source: SNL) |
| (5) | Total Written Premium Growth - Relates to Horace Mann written premium growth measuredMeasured as the compound annual growth rate from CAGR over the period 12/31/2014 to 12/31/2017 for Auto, Property, AnnuityWritten Premium Growth for HMN auto, property, and Life.life and total retirement sales for annuity (HMN, RIA and institutional platform) and HMGA. |
These three measuresStrategic Incentive Grants
As disclosed in our 2016 and 2017 Proxy Statements, in March 2016, we made strategic equity grants to key executives, including four of the 2017 NEOs, under our CECP. Each executive received a provisional equity grant of PBRSUs contingent on a corporate financial performance goal, earnings per share, and individual strategic goals. If the Performance Goal is satisfied, 50% of the award will be earned and vested on January 1, 2019. The remaining 50% of the award will also be eligible for the 2015-2017 period focusvesting on the effective useJanuary 1, 2019 subject to achievement of capital and delivering on growth objectives while retaining our strong alignment with Shareholder interests. Annual Incentive Planindividual strategic goals.
The Annual Incentiveindividual goal-based PBRSUs: Do not vest unless the established individual strategic goals are achieved during the performance measures provide balance between Shareholder return (operating incomeperiod beginning on January 1, 2016, and ending on December 31, 2018; Are reduced to zero, if the corporate performance goal is not achieved; Cannot exceed the number of shares granted (except through accrued dividend equivalents); and Will be reduced if all individual strategic goals and their components are partially met. The entire award is subject to satisfaction of an objective threshold Company-wide performance goal, which must be met during the performance period beginning on January 1, 2016 and ending on December 31, 2018. If an unexpected event occurs triggering a significant loss, the awards could be eliminated entirely. These 2016 awards are reflected in the 2016 data in the Summary Compensation Table. No strategic incentive equity awards were made in 2017. | | | | 30 | | 2018 Proxy Statement • Compensation Discussion and Analysis |
Additional Pay Practices Stock Ownership & Holding Guidelines Our Executive Officers are required to accumulate and maintain beneficial stock ownership – calculated as a percentage of base salary - 50%) and growth (sales and revenues - 50%). Further, these measures were designed to complementas displayed in the metrics of the Long-term Incentive which focus on long-term shareholder value creation. The performance measures correspond to our financial plan (“Plan”) objectives approved by the Committee. The Annual Incentive is paid in cash. 2015 Annual Incentive Performance Measurestable below:
| | | 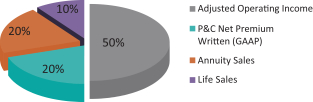
| | Adjusted Operating Income - Operating income (GAAP net income after tax, excluding realized investment gains and losses other than those for FIA related options and embedded derivatives) adjusted for Property & Casualty (“P&C”) catastrophe costs different than Plan, Annuity & Life deferred acquisition costs (“DAC”) unlocking and change in guaranteed minimum death benefit (“GMDB”) reserve due to capital gains and losses and market performance different than Plan, the impact on investment income of share repurchases different than Plan, and debt structure/costs including debt retirement different than Plan
P&C Net Premium Written (GAAP) - Amount charged for property and casualty policies issued during the year; portions of such amounts may be earned and included in financial reports over future periods
Annuity Sales - The amount of new business from the sales of Horace Mann annuity products, from Horace Mann and independent agents, as measured by premiums and deposits to be collected over the 12 months following the sale
Life Sales - The amount of new Horace Mann individual life insurance products sold during the year, as measured by premiums and deposits to be collected over the 12 months following the sale
|
| | | 2016 Proxy Statement • Compensation Discussion and Analysis | | 13 |
Pay GovernancePosition
Committee Oversight
The Committee oversees the compensation program for our NEOs. The compensation program is designed to provide a direct and clear link between the performance of the Company and executive pay. To assist in the construct of the compensation program design, the assessment of the program’s relevance to current market trends and the analysis of the program’s effectiveness, the Committee retained Compensation Advisory Partners LLC (“CAP”) as independent compensation consultants who report directly to the Committee. CAP attends Committee meetings, including portions of executive sessions, and serves solely at the pleasure of the Committee.
As will be discussed in more detail in next year’s proxy statement, in March 2016, the Company made performance-based Restricted Stock Unit (RSUs) grants to key executives, including the NEOs, under our 2010 Comprehensive Executive Compensation Plan (as amended and restated effective May 20, 2015) (“CECP”). All such grants are subject to satisfaction of certain objective threshold company-wide performance standards. The Company’s success makes our leadership team more vulnerable to recruitment by competitors. The Committee believes the grants promote continuity and retention of our strong leadership team as we pursue our aggressive 20/20 Vision, and also strengthen management’s alignment with Shareholder interests.
In addition, the Committee believes its oversight of executive compensation is strongly enhanced by the on-going education of each Committee member on emerging legislation, regulatory guidelines and industry best practices. This is done through review of topical publications, participation in webcasts, attendance at seminars and conferences on executive compensation and formal updates by CAP and other external experts during Committee meetings. Committee members provide management and CAP with topics for presentation and discussion prior to each meeting. During the Committee meetings, Committee members, the Board’s outside legal counsel, management and CAP discuss executive compensation, benefits and related issues and their relevancy to the Company, its Shareholders and its executive compensation program. The Committee has an executive session, without management present, during each of its meetings.
| | | | | | | | | | | | | Stock Ownership & Holding Requirements
The Company’s Long-term Incentive Plan has been 100% equity-based since 2009. The equity is
comprised of a combination of stock options, performance-based RSUs and service-based RSUs.
Paying these incentives solely in equity-based instruments and requiring executives to meet
specific stock ownership requirements further serves to align our executives’ and Shareholders’
interests. As part of its 2015 overall review of the executive compensation program, the
Committee determined the existing multiples of base salary stock ownership requirements for the
Executive Officers were appropriate and would be continued in 2016. The CEO is required to
accumulate and maintain beneficial stock ownership with a book value of at least 500% of base
salary and all other NEOs to accumulate and maintain beneficial stock ownership with a book
value of at least 350% of base salary. Currently, our NEOs are required to satisfy stock ownership
| | Stock
Ownership
Target % Requirements (1)
| | | CEO | | | 500% | | | All other NEOs | | | 350% | | | (1) Percentage of base salary
| | | CEO | | 500% | Executive Vice President | | 350% | Senior Vice President | | 300% | Controller | | 200% |
levelsWe use book value to measure the value of the shares we require the NEOs to own because book value is less volatile than stock price. For this purpose, the Company’s book value per share is determined by dividing total Shareholders’ equity, less the fair value adjustment for investments, by the number of outstanding shares of common stock.
The NEOs must satisfy stock ownership guidelines within five years of attaining their position. Stock ownership may be achieved by direct ownership or beneficial ownership, including shares held through the Horace Mann 401(k) Plan and RSUs (vested and unvested), as well as beneficial ownership through a spouse, child, or trust. Outstanding stock options are not used in determining stock ownership. Beginning with the March 9, 2011 stock option grants themade in 2011, NEOs are required to hold shares equivalent to any proceeds from a long-term incentive stock option exercise, net of exercise price and related taxes and the costs of the exercise, for a minimum of twelve months after the date of exercise. AllAs part of its 2017 overall review of the executive compensation program, the Committee reviewed the stock ownership guidelines for the Executive Officers, and determined they were appropriate and will be continued in 2018. As indicated in the following chart, all NEOs have met or areexceeded their stock ownership guidelines except for Mr. Carley. Mr. Carley joined the Company in January 2016, and is on target to meet the requirement by the deadline. 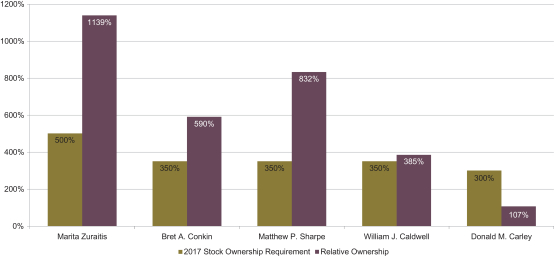
| | | | 2018 Proxy Statement • Compensation Discussion and Analysis | | 31 |
| | | | | | | | | | Named Individual | | Stock
Ownership
Target % | | Stock
Ownership
Actual % | | Stock
Ownership (1) | | Book
Value (2) | Marita Zuraitis | | 500% | | 1139% | | 328,113 | | $9,682,616 | Bret A. Conklin | | 350% | | 590% | | 63,982 | | $1,888,121 | Matthew P. Sharpe | | 350% | | 832% | | 117,055 | | $3,454,300 | William J. Caldwell | | 350% | | 385% | | 48,921 | | $1,443,671 | Donald M. Carley | | 300% | | 107% | | 10,846 | | $ 320,061 | HMN Stock Price @ 12/31/2017 = | | $44.10 | HM Book Value @ 12/31/2017 = | | $29.51 |
| (1) | Represents share ownership as of 12/31/17 |
| (2) | Represents book value per share excluding the fair value adjustment for investments |
Minimum Vesting Period In 2017, through an amendment approved by the Board, the Company updated the CECP to reflect a minimum vesting period of one year for all equity grants. No portion of any equity grant, including stock ownership requirements.options, stock appreciation rights, restricted stock or RSUs, will become vested before the first anniversary of the grant date except in the cases of death or disability. Annual Performance &and Pay Review To further reinforce a performance-based culture and the tie between Company results and compensation, each executive officer’s performance is reviewed by the Committee every 12 months,reviews each Executive Officer’s performance annually, coinciding with the review of corporate performance results. Each executive officerExecutive Officer is reviewed not only on prior year business results but also on the individual’s demonstration of leadership skills and progress on specific strategic initiatives and other key priorities. The Committee also considers any adjustments to base salary, long-termannual incentive opportunity, and annuallong-term incentive opportunity at this review. The Committee recognizes the need to have market-competitive compensation opportunities to attract, retain, and reward high performing executive talent. CAP reviews our executive compensation and compensation practices relative to the competitive market. Overall, our total target compensation is comparable to the market median, with above-target performance allowing for the possibility of total compensation greater than market median and below-target performance resulting in total compensation below market median. Risk AssessmentBase Salary
Competitive base salaries are critical to attracting and retaining high performing executive talent. The Committee seeks to pay salaries that approximate median salaries for executives of similar companies in like positions. However, in recruiting new executives, we sometimes exceed these guidelines to attract qualified candidates. There may also be instances where an existing executive’s compensation deviates from the median, up or down, due to experience, performance, responsibilities, compensation history, internal equity, or retention risk. Salaries for the NEOs and other executive officers are reviewed every 12 months in connection with the review of financial results for the prior fiscal year and the annual performance review discussed under “Annual Performance and Pay Review” below. In 2017, Ms. Zuraitis, Mr. Sharpe, and Mr. Caldwell received base salary increases to move overall compensation closer to the market median. Mr. Conklin received a base salary increase to recognize his promotion to EVP and CFO. Mr. Carley did not receive a base salary increase in 2017. Base salary adjustments for 2017 are shown in the chart below. | | | | | | | | | | | | Named Individual | | 2016
Annualized
Salary | | | 2017
Annualized
Salary | | | Percent
Increase | Marita Zuraitis | | | $800,000 | | | | $850,000 | | | 6.3% | Bret A. Conklin | | | $275,000 | | | | $320,000 | | | 16.4% | Matthew P. Sharpe | | | $400,000 | | | | $415,000 | | | 3.8% | William J. Caldwell | | | $350,000 | | | | $375,000 | | | 7.1% | Donald M. Carley | | | $300,000 | | | | $300,000 | | | 0.0% |
| | | | 2018 Proxy Statement • Compensation Discussion and Analysis | | 25 |
Annual Incentive Plan Our programsAIP is a cash incentive plan, administered under the CECP, and designed to drive and reward strong performance over aone-year period. Annually, the Committee establishes the performance objectives, threshold, target and maximum performance levels, and the related threshold, target and maximum AIP opportunities for each NEO, expressed as a percentage of base salary. Target incentive opportunity levels for the NEOs are structuredintended to discourage excessive risk-taking throughapproximate the median of the target bonus potential for similarly situated executives in comparable companies. Maximum incentive opportunities are set at 200% of target. For 2017, there were four performance measures, with 50% of the award based on Company-wide net operating income, and the remaining 50% divided among specific sales and premiums of the different business lines: P&C net written premium (20%), retirement sales (20%), and life sales (10%), as shown in the chart below. This provides a balanced use of compensation vehiclesbalance between shareholder return and growth, while complementing the longer-term LTIP metrics, with an overall goal of delivering sustainedwhich focus on long-term shareholder value while aligning our executives’ interests with those of our Shareholders. To this end, management and CAP conduct, and the Committee and the Board’s outside legal counsel reviews, an annual risk analysis of the compensation plans and incentive metrics. Our programs require that a substantial portion of each executive officer’s compensation be contingent on delivering performance results that benefit our Shareholders. In addition, a significant portion of our NEOs’ compensation is delivered in equity over a multi-year timeframe and each executive is expected to satisfy meaningful stock ownership requirements as well as comply with holding requirements. Furthermore, incentive compensation is subject to clawbacks. Similarly, we have stock ownership requirements for our non-employee Directors which are described under “Director Compensation.” The Committee has been advised by the Board’s outside legal counsel and agrees that no unreasonable risk exists that a compensation policy or incentive plan would have a material adverse impact on the Company.creation. 2017 Annual Incentive Plan Performance Measures | | | 14 | | 2016 Proxy Statement • Compensation DiscussionAdjusted Operating Income - Operating income (GAAP net income after tax, excluding realized investment gains and Analysislosses other than those for Fixed Indexed Annuity related options and embedded derivatives) adjusted for P&C catastrophe costs different than the annual Plan, Annuity & Life deferred acquisition costs (“DAC”) unlocking and change in guaranteed minimum death benefit (“GMDB”) reserve due to capital gains and losses and market performance different than Plan, the impact on investment income of share repurchases different than Plan, and debt structure/costs including debt retirement different than Plan. P&C Net Premium Written (GAAP) - Amount charged for property and casualty policies issued during the year. (Portions of such amounts may be earned and included in financial reports over future periods.) Retirement Sales - The amount of new business from the sales of Horace Mann annuity products, from Horace Mann and independent agents, as measured by premiums and deposits to be collected over the 12 months following the sale. Life Sales - The amount of new Horace Mann individual life insurance products sold during the year, as measured by premiums and deposits to be collected over the 12 months following the sale. |
Succession Planning Process
To further mitigate enterprise riskAll the NEOs’ 2017 annual incentive amounts are based on the same corporate and ensure the Company does not suffer sustained gaps in leadership, the Committee approves, oversees and monitors the Company’s succession planning process. This process identifies candidates that have the skill sets, background, training, and industry knowledgebusiness line objectives to assume critical positions on an emergency basis and alsopromote cooperation. The targets for the long-term executive succession plan. The Company’s succession plan is reviewed by the full Board annually.
Minimal Use of Employment Agreements
As of the time of this Proxy Statement, the Company did not have any individual employment agreements with any executiveoperating income and intends to continue to minimize their use, while recognizing that in isolated situations they may be needed for attraction and retention of key executive talent.
Change in Control and Elimination of Prospective Gross-ups
Four of the NEOs are covered under the Horace Mann Service Corporation Executive Change in Control Plan (“Executive CIC Plan”). This plan provides “double trigger” benefits and does not contain a tax gross-up provision. The Company does have an individual change in control severance agreement with Mr. Hallman, which provides severance pay, including a “parachute tax” gross-up payment, in the event of an actualsales or constructive termination of employment within a fixed time after a change in control of the Company, as defined in the agreement (a “double trigger”). The Committee has determined that, while it cannot change unilaterally any existing change in control severance agreements with current executives, it does not plan to include tax gross-up provisions in any future agreements.
Clawbacks
The Committee further believes that our compensation program should reward performance that supports the Company’s culture of integrity through compliance with applicable laws and regulations and our codes of ethics and conduct. As a further step to support that belief, the Committee has determined that all executive officers are subject to the same standards as the CEO and CFO regarding cash compensation clawbacks as defined under Section 404 of the Sarbanes-Oxley Act of 2002. In addition, under the CECP, the Company has the right to recover any cash or equity award if it is determined that an executive’s own misconduct contributed materially to the executive’s receipt of an award. New guidance under the Dodd-Frank Act related to clawbacks has been proposed by the Securities and Exchange Commission and the Company will modify the current clawback provisions to comply with the guidance when finalized.
Favorable Say on Pay
At our 2015 Annual Meeting of Shareholders, we received substantial support for the compensation of our NEOs, with 97.27% of the votes cast in favor of the “Say on Pay” advisory vote on executive compensation. The Compensation Committee and the Board appreciate and value the views of our Shareholders. In considering the results of this advisory vote, the Compensation Committee was pleased that a significant majority of our Shareholders approved the proposal, showing strong support for the structure of the compensation plans, the absence of excessive perquisites, the demonstrated pay-for-performance practices and the strength of the Company’s compensation processes and practices.
Hedging Prohibition
NEOs and other executive officers are prohibited from engaging in hedging transactions in HMEC common stock.
Pledging Prohibition
Beginning in 2013, NEOs and other executive officers have been prohibited from pledging their HMEC common stock shares.
Perquisites and Personal Benefits
We provide limited perquisites, which are commonly provided among our peer companies. Please see the “Summary Compensation Table” for further details.
premium | | | 201626 | | 2018 Proxy Statement • Compensation Discussion and Analysis |
measures were based on a review of market conditions and expectations of other companies in the industry as well as our financial plan for 2017 (“2017 Plan”). The 2017 Plan was the basis of our 2017 earnings guidance, which was publicly disclosed in February 2017 in connection with our release of earnings for the year ended December 31, 2016. The Committee believes that tying the AIP to Company performance provides appropriate alignment for an executive’s compensation as it recognizes that the Company as a whole must perform well in order to deliver value to our Shareholders. Further, tying all the NEOs’ AIP awards to the performance of specific business lines incentivizes cooperation among the business line leaders. It is the goal of the Committee to establish measurements and targets that are reasonable, but not easily achieved. The measures and targets are discussed with the CEO, other NEOs, other members of the Board and CAP before they are set. Each March, the Committee certifies performance and determines AIP payouts for the prior year. Based on the 2017 results of 95.46% of target for Ms. Zuraitis and the other NEOs, the 2017 AIP payouts (paid in March 2018) were as follows: | | | | | | | | | | | | | | | | | | | | | | | | | | | | | | | | | | | | 2017 AIP Measures (in $M) | | Threshold | | Target | | Maximum | | Actual | | Results | | Weighting | | Payout | Adjusted Operating Income | | | | 77.9 | | | | | 83.8 | | | | | 92.5 | | | | | 87.2 | | | | | 139 | % | | | | 50 | % | | | | 69.48 | % | P&C Net Premium Written | | | | 651.7 | | | | | 662.7 | | | | | 673.7 | | | | | 662.8 | | | | | 101 | % | | | | 20 | % | | | | 20.18 | % | Horace Mann Retirement Sales | | | | 422.3 | | | | | 435.3 | | | | | 448.3 | | | | | 367.3 | | | | | 0 | % | | | | 20 | % | | | | 0.00 | % | Horace Mann Life Sales | | | | 17.6 | | | | | 18.5 | | | | | 19.4 | | | | | 17.74 | | | | | 58 | % | | | | 10 | % | | | | 5.80 | % | Total | | | | | | | | | | | | | | | | | | | | | | | | | | | | | 100 | % | | | | 95.46 | % |
| | | | | | | | Named Individual | | 2017 Target
AIP Opportunity1 | | 2017 Actual
AIP Payout | | 2017 Actual AIP Payout
as a % of Base Salary | Marita Zuraitis | | 100% | | $803,455 | | 94.52% | Bret A. Conklin | | 35%/50% | | $134,200 | | 41.94% | Matthew P. Sharpe | | 60% | | $236,264 | | 56.93% | William J. Caldwell | | 60% | | $212,398 | | 56.64% | Donald M. Carley | | 40% | | $114,552 | | 38.18% |
(1) Mr. Conklin’s Target AIP Opportunity was increased to 50% upon his promotion to EVP & CFO
| | | | 2018 Proxy Statement • Compensation Discussion and Analysis | | 1527 |
Executive Compensation ProgramLong-term Incentive Plan
| | | | | | | Oversight
The Committee oversees our executive compensation program. The current members of the Committee are Dr. Futrell, Mr. Hasenmiller, Ms. McClure, and Mr. Shaheen. Mr. Hasenmiller serves as the Committee Chair. Consistent with the listing standards of the NYSE, the Committee is composed entirely of independent Directors.
| | | | The Compensation Committee is composed entirely of independent Directors.
| | |
The Committee has retained CAPintent of our LTIP is to provide informationfocus executives on shareholder value and advice onkey strategic objectives, while promoting retention. 2017 LTIP Aggregate Target Opportunity In setting the competitive marketdollar values of the 2017 opportunities under LTIP for executive talent, evolving market practices in our industry and the general employment market, regulatory and other external developments, and our executive compensation philosophy and incentive program design. The CAP consultants report directly toeach NEO, the Committee attend the Committee meetings and portions of executive sessions of the Committee at the Chair’s request and serve at the pleasure of the Committee. CAP performs no other services for management or the Committee. CAP works with management to obtain necessary data and perspectives ontargeted amounts that would achieve the Company’s strategic objectives, business environment, corporate culture, performance and other areas. This information is used by CAP to formulate its recommendations related to competitiveoverall objective of positioning total compensation performance targets and overall design. CAP’s findings and recommendations are reported directly toat approximately the Committee.market median. The services provided by CAP during 2015 are described in more detail throughout this analysis. Pursuant to regulatory requirements,2017 target grant values for the Committee has assessed CAP’s independence and concluded that CAP’s work did not raise any conflict of interest. In addition, the Committee has the authority to hire other experts and advisorsNEOs were as it deems necessary. Management also supports the Committee by providing analysis and recommendations. When setting levels of executive compensation, the Committee requests, receives and considers the recommendations of the CEO regarding the performance of her direct reports and other Executive Officers. Members of management also attend and contribute to Committee meetings as relevant to the Committee agenda.
The Committee discusses its fundamental views on compensation and guiding principles, as well as its expectations of the CEO’s performance and annual goals, with the CEO and subsequently proposes the CEO’s goals to the Board for approval. The Committee does not include the CEO or other members of management in its discussions with CAP on the CEO’s compensation, nor does the CEO or management participate in the Committee’s recommendation to the Board on the CEO’s compensation. The Committee reviewed the performance and compensation of specified Long-term Incentive Plan (“LTI”) participants on a common review date concurrent with the annual review of the prior year’s performance under the incentive plans.follows:
| | | | | Guiding Principles
The Committee has established the following core principles that underlie our executive compensation program: Named Individual
• Executive interests should be aligned with Shareholders;
| | • Incentive compensation should be structured to drive long-term value creation and reward strong performance;
• A significant portion of compensation should be “at risk” based on the Company’s performance; and
• Compensation levels should be market competitive.2017 LTIP
Target
| | Marita Zuraitis | | | $1,550,000 | | Bret A. Conklin | | | $280,000 | | Matthew P. Sharpe | | | $565,000 | | William J. Caldwell | | | $360,000 | | Donald M. Carley | | | $285,000 | |
Executive interests should be aligned with Shareholders2017 LTIP Award Vehicles
Our incentive plans facilitateFor 2017, LTIP is comprised of three vehicles, as illustrated in the chart below: (1) performance-based RSUs; (2) service-vested RSUs; and (3) service-vested stock ownershipoptions.
| | | | | Performance-based RSUs - Earned over a three-year period, based upon Relative and Absolute Measures. If any shares are earned at the end of the three-year performance period, the executive fully vests in the award | | Service-vested RSUs - Vest ratably over 3 years | | Stock options - Granted at fair market value with a 10 year life; options vest ratably over 4 years |
Performance-Based RSUs (PBRSUs) The Committee believes that PBRSUs provide an effective vehicle for rewarding executives based on a three-year performance period. Each year, a new three-year period starts, partially overlapping the periods that started the prior two years. PBRSUs were granted on March 7, 2017 for the 2017-2019 performance period, and include performance measures that drive long-term sustained shareholder value. The Company grants equity awards with multi-year performance periods to reward sustained performance and multi-year vesting to encourage retention. We allow deferrals of RSU awards and our executives are also required to satisfy meaningful stock ownership requirements. In 2015 through the Long-term Incentive Plan, we delivered approximately 43% of Ms. Zuraitis’s compensation in equity. With respect to the other NEOs, approximately 37% to 44% of their compensation was delivered in equity. Incentive compensation should be structured to drive long-term value creation and reward strong performance
Our executive compensation program includes significant equity-based and cash-based incentives intended to drive long-term and short-term value creation. The Long-term Incentive Plan deliverscomprise 50% of the long-term incentive opportunities2017 LTIP opportunity. These RSUs will be earned and vested on December 31, 2019, based on the level of achievement, though no RSUs will be earned if threshold level of performance is not achieved. From the date of grant, PBRSUs accrue dividend equivalents at the same rate as dividends paid to our shareholders, but the dividend equivalents are only paid on the corresponding shares that are earned. If no shares are earned, the dividend equivalents are forfeited. Earned dividend equivalents are converted into additional RSUs.
Service-vested RSUs The Committee believes that service-vested RSUs assist in performance-basedthe retention of key executive talent. Service-vested RSUs were granted on March 7, 2017 and 50% in service-based equity awards. The minimumcomprise 20% of the 2017 LTIP opportunity. Service-vested RSUs vest 33% after the first year, vest an additional 33% after the second year and vest the final 34% after the third year from the grant date, and are subject to continued employment to the vesting period for any equity award is three yearsdate. From the date of the grant, the RSUs accrue dividend equivalents at the same rate as dividends paid to our Shareholders. These dividend equivalents are converted into additional RSUs and vest when the maximum is four years. The Annual Incentive is solely performance-based and paid in cash. underlying RSUs vest. | | | 1628 | | 20162018 Proxy Statement • Compensation Discussion and Analysis |
A significant portion of compensation should be “at risk” basedStock Options
The Committee believes that stock options provide strong alignment with Shareholder interests, as executives do not realize any value unless our stock price appreciates. They also promote retention. Stock options granted under the LTIP have an exercise price equal to the closing stock price on the date of grant, vest ratably over a four-year period subject to continued employment on each vesting date and have aten-year term. Stock options were granted on March 7, 2017 and comprise 30% of the 2017 LTIP opportunity. Beginning with the 2017 LTIP grant, the Company transitioned from a blend of Incentive Stock Options (ISO) andNon-qualified Stock Options (NQSO) to all NQSOs. The number of options granted was determined using the Black-Scholes valuation method. For additional information regarding assumptions used for these valuations, see the Company’s 2017 Annual Report and Form10-K “Notes to Consolidated Financial Statements – Note 1 – Summary of Significant Accounting Policies – Share-Based Compensation.” Upon exercise Executive Officers are required to hold shares equivalent to any proceeds (net of exercise price and related taxes and the costs of the exercise) for a minimum of twelve months. Timing of Equity Grants The Committee has granted long-term incentives only at its regularly scheduled Board meetings. The grant date is the applicable resolution as approved or a future date as otherwise specified in the resolution. 2017-2019 Performance-based RSUs The Performance-based RSUs granted in 2017 have three performance measures as shown below: | | | | | Relative Total Shareholder Return - Relative Total Shareholder Return for the three-year period measured against a peer group of companies. Relative Operating Return on Equity - Average annual relative Operating Income return on average equity for the three-year period measured against a peer group of companies. Total Revenue Growth - Measured as the CAGR over the period 12/31/2016 to 12/31/2019 for Written Premium Growth for HMN auto, property, and life and total retirement sales for annuity (HMN, RIA and institutional platform) and HMGA. |
Prior Years PBRSU Grants 2016-2018 PBRSUs The PBRSUs granted in 2016 will not mature until December 31, 2018. Since the applicable3-year performance period has not yet ended, actual performance against targets is not yet known. | | | | 2018 Proxy Statement • Compensation Discussion and Analysis | | 29 |
2015-2017 PBRSUs The performance-based RSUs granted in 2015 matured and vested as of December 31, 2017. The performance measures, targets and payout levels for the PBRSUs granted in 2015 are as follows: | | | | | | | | | | | | | | | | Measures | | Threshold (2) | | Target (2) | | Maximum (2) | | Weighting | | | Weighted Result
at 12/31/2017 | | Relative(1) Measures | | | | | | | | | | | | | | | TSR(3) | | 25th
Percentile
Ranking vs
Peer Co’s | | 50th
Percentile
Ranking vs
Peer Co’s | | 90th
Percentile
Ranking vs
Peer Co’s | | | 40% | | | | 46% | | Operating ROE(4) | | 25th
Percentile
Ranking vs
Peer Co’s | | 50th
Percentile
Ranking vs
Peer Co’s | | 90th
Percentile
Ranking vs
Peer Co’s | | | 40% | | | | 53% | | Absolute Measure | | | | | | | | | | | | | | | Total Written Premium Growth(5) | | 2% | | 3% | | 5% | | | 20% | | | | 19% | | | | | | | | | | | | | | | 118% | |
Notes: | (1) | Peer group comprised of Russell 2000 Index insurance companies excluding brokerage, reinsurance, financial guarantee, and health companies. |
| (2) | Threshold award (25th percentile) is 50% of target LTI opportunity; Target award (50th percentile) is 100%; Maximum (90th percentile) is 200% of target. Awards for results between Threshold-Target and Target-Maximum will be interpolated. |
| (3) | Total Shareholder Return for the 3 year period. Measures from the average price 5 trading days before and 5 trading days after the beginning of the measurement period (1/1/15) to the average price 5 trading days before and 5 trading days after the end of the measurement period (12/31/17). (Source: Bloomberg) |
| (4) | Average annual Operating Income Return on Average Equity (excluding FAS 115) for the 3 years. (Source: SNL) |
| (5) | Total Written Premium Growth - Measured as the CAGR over the period 12/31/2014 to 12/31/2017 for Written Premium Growth for HMN auto, property, and life and total retirement sales for annuity (HMN, RIA and institutional platform) and HMGA. |
Strategic Incentive Grants As disclosed in our 2016 and 2017 Proxy Statements, in March 2016, we made strategic equity grants to key executives, including four of the 2017 NEOs, under our CECP. Each executive received a provisional equity grant of PBRSUs contingent on a corporate financial performance goal, earnings per share, and individual strategic goals. If the Performance Goal is satisfied, 50% of the award will be earned and vested on January 1, 2019. The remaining 50% of the award will also be eligible for vesting on January 1, 2019 subject to achievement of individual strategic goals. The individual goal-based PBRSUs: Do not vest unless the established individual strategic goals are achieved during the performance period beginning on January 1, 2016, and ending on December 31, 2018; Are reduced to zero, if the corporate performance goal is not achieved; Cannot exceed the number of shares granted (except through accrued dividend equivalents); and Will be reduced if all individual strategic goals and their components are partially met. The entire award is subject to satisfaction of an objective threshold Company-wide performance goal, which must be met during the performance period beginning on January 1, 2016 and ending on December 31, 2018. If an unexpected event occurs triggering a significant loss, the awards could be eliminated entirely. These 2016 awards are reflected in the 2016 data in the Summary Compensation Table. No strategic incentive equity awards were made in 2017. | | | | 30 | | 2018 Proxy Statement • Compensation Discussion and Analysis |
Additional Pay Practices Stock Ownership & Holding Guidelines Our Executive Officers are required to accumulate and maintain beneficial stock ownership – calculated as a percentage of base salary - as displayed in the table below: | | | Over 70% of the CEO’s target
total pay is at risk and over
56% of target total pay for all
other NEOs is at risk.Position
| | | | Generally, over 70% of the CEO’s target total pay and over 56% of target total pay for all other
NEOs (base salary plus target annual incentive plus target long-term incentive) is at risk, is
variable from year to year, and demonstrates a strong link between pay and performance. To
further enhance the pay-for-performance linkage, we incorporate performance relative to
comparable companies into our long-term incentive measures.
|
Compensation levels should be market competitive
The Committee believes a competitive compensation program is critical in attracting and retaining top executives. Consequently, when making compensation decisions, the Committee considers the compensation opportunities provided to similarly situated executives at comparable companies as well as how compensation is delivered (e.g., short-term vs. long-term and fixed vs. variable).
Assessing Compensation Competitiveness
| | | | | | | The Committee intends to set total direct compensation for the NEOs – salary and target annual and long-term incentive opportunities – within a reasonable range of the median of the competitive market, while providing the opportunity for additional compensation if warranted by performance. To determine competitive pay levels, we use comparable survey market data provided by our independent consultant, CAP,
| and from published survey sources including LOMA, Towers Watson, and proxy data for similar sized insurance companies in the Russell 2000® Index. The data from these surveys is scaled to our size by CAP based on revenues or asset ranges as provided by the various surveys. The NEOs are assessed against comparable functional matches in the insurance industry and the broader general industry, as appropriate.
Every year, CAP provides the Committee with a comparison of the base salary, annual incentives and long-term incentives of the CEO with those of other chief executive officers based on survey data. Based on the data, CAP
| | | | 2015 Consultant Survey SourcesStock
Ownership
Target %
| • LOMA: Executive Compensation Survey
• Towers Watson: Top Management Compensation Survey
• Proxy Data for Insurance companies in the Russell 2000® Index
CEO | | 500% | makes recommendations for CEO compensation for the Committee’s consideration. The Committee then deliberates in executive session to determine its recommendation for approval by the Board of Directors.Executive Vice President
| | 350% | Senior Vice President | | 300% | Controller | | 200% |
For 2015,We use book value to measure the CAP analysis demonstrated that the average of 2015 total direct compensation was consistent with target pay positioning at the medianvalue of the market. Thisshares we require the NEOs to own because book value is consistentless volatile than stock price. For this purpose, the Company’s book value per share is determined by dividing total Shareholders’ equity, less the fair value adjustment for investments, by the number of outstanding shares of common stock.
The NEOs must satisfy stock ownership guidelines within five years of attaining their position. Stock ownership may be achieved by direct ownership or beneficial ownership, including shares held through the Horace Mann 401(k) Plan and RSUs (vested and unvested), as well as beneficial ownership through a spouse, child, or trust. Outstanding stock options are not used in determining stock ownership. Beginning with stock option grants made in 2011, NEOs are required to hold shares equivalent to any proceeds from a long-term incentive stock option exercise, net of exercise price and related taxes and the Committee’scosts of the exercise, for a minimum of twelve months after the date of exercise. As part of its 2017 overall review of the executive compensation philosophy.program, the Committee reviewed the stock ownership guidelines for the Executive Officers, and determined they were appropriate and will be continued in 2018. As indicated in the following chart, all NEOs have met or exceeded their stock ownership guidelines except for Mr. Carley. Mr. Carley joined the Company in January 2016, and is on target to meet the requirement by the deadline.
| | | 20162018 Proxy Statement • Compensation Discussion and Analysis | | 31 |
| | | | | | | | | | Named Individual | | Stock
Ownership
Target % | | Stock
Ownership
Actual % | | Stock
Ownership (1) | | Book
Value (2) | Marita Zuraitis | | 500% | | 1139% | | 328,113 | | $9,682,616 | Bret A. Conklin | | 350% | | 590% | | 63,982 | | $1,888,121 | Matthew P. Sharpe | | 350% | | 832% | | 117,055 | | $3,454,300 | William J. Caldwell | | 350% | | 385% | | 48,921 | | $1,443,671 | Donald M. Carley | | 300% | | 107% | | 10,846 | | $ 320,061 | HMN Stock Price @ 12/31/2017 = | | $44.10 | HM Book Value @ 12/31/2017 = | | $29.51 |
| (1) | Represents share ownership as of 12/31/17 |
| (2) | Represents book value per share excluding the fair value adjustment for investments |
Compensation MixMinimum Vesting Period
We structure our executive compensation programIn 2017, through an amendment approved by the Board, the Company updated the CECP to deliverreflect a minimum vesting period of one year for all equity grants. No portion of any equity grant, including stock options, stock appreciation rights, restricted stock or RSUs, will become vested before the majorityfirst anniversary of pay through incentives driving both operatingthe grant date except in the cases of death or disability.
Annual Performance and Pay Review To further reinforce a performance-based culture and the tie between Company results and compensation, the Committee reviews each Executive Officer’s performance annually, coinciding with the review of corporate performance results. Each Executive Officer is reviewed not only on prior year business results but also on the individual’s demonstration of leadership skills and progress on specific strategic initiatives and other key priorities. The Committee also considers any adjustments to base salary, annual incentive opportunity, and long-term valueincentive opportunity at this review. The Committee recognizes the need to have market-competitive compensation opportunities to attract, retain, and positioning more than half of each NEO’s pay at risk. The targeted compensation mix of total direct compensation for the NEOs at the beginning of 2015 is illustrated below. The mix of 2015 actual compensation varied as a result of actual incentives earned.reward high performing executive talent. 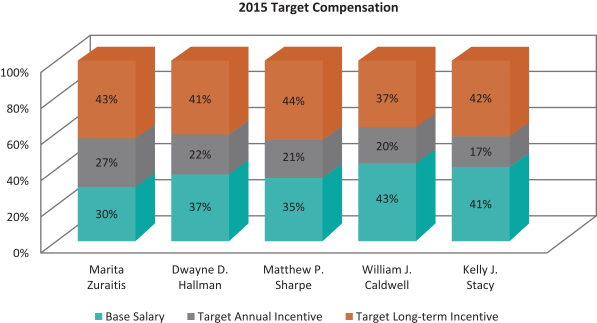
Base Salary Competitive base salaries are critical to attracting and retaining high performing executive talent. The Committee seeks to pay salaries that approximate median industry salaries for executives of similar companies in like positions. In order to determine competitive positioning, the Committee requests CAP to assess compensation for the CEO and the four other NEOs. CAP makes their comparisons based on industry norms, represented by survey compensation for comparable positions in the insurance industry and general industry, and this information is used as a reference point for the Committee. However, in recruiting new executives, we sometimes exceed these guidelines are sometimes exceeded to attract qualified candidates. There may also be instances where an existing executive’s compensation deviates from the median, either up or down, due to experience, performance, responsibilities, compensation history, internal equity, and/or retention risk with no pre-determined goals assigned to such considerations.risk. Salaries for Executive Officersthe NEOs and other executive officers are reviewed every 12 months in connection with the review of financial results for the prior fiscal year.year and the annual performance review discussed under “Annual Performance and Pay Review” below. In addition2017, Ms. Zuraitis, Mr. Sharpe, and Mr. Caldwell received base salary increases to consideringmove overall compensation closer to the market data,median. Mr. Conklin received a base salary increase to recognize his promotion to EVP and CFO. Mr. Carley did not receive a base salary increase in 2017. Base salary adjustments for 2017 are shown in the Committee reviews each executive’s performance, including the accomplishment of key corporate, strategic, operational, financial and management goals, and upholding our standards of ethical conduct.chart below. | | | | | | | | | | | | | | | Name | |
| 2014
Annualized Salary |
| |
| 2015
Annualized Salary |
| | | Percent of 2015 Increase | | | Reason For Increase | Marita Zuraitis | | | $704,000 | | | | $750,000 | | | | 6.53% | | | (1) | Dwayne D. Hallman | | | $444,000 | | | | $444,000 | | | | 0% | | | | Matthew P. Sharpe | | | $364,000 | | | | $400,000 | | | | 9.89% | | | (2) | William J. Caldwell | | | $300,000 | | | | $350,000 | | | | 16.67% | | | (3) | Kelly J. Stacy | | | N/A | | | | $300,000 | | | | N/A | | | (4) |
N/A – Not applicable
| | | | | | | | | | | | Named Individual | | 2016
Annualized
Salary | | | 2017
Annualized
Salary | | | Percent
Increase | Marita Zuraitis | | | $800,000 | | | | $850,000 | | | 6.3% | Bret A. Conklin | | | $275,000 | | | | $320,000 | | | 16.4% | Matthew P. Sharpe | | | $400,000 | | | | $415,000 | | | 3.8% | William J. Caldwell | | | $350,000 | | | | $375,000 | | | 7.1% | Donald M. Carley | | | $300,000 | | | | $300,000 | | | 0.0% |
(1) | Ms. Zuraitis’ adjustment was made to move her overall compensation closer to the market median
| | | 2018 Proxy Statement • Compensation Discussion and Analysis | | 25 |
Annual Incentive Plan (2) | Salary adjustment was made based on Mr. Sharpe’s performance in 2014, specifically in product development and annuity sales, and to move his overall compensation closer to the market median
|
Our AIP is a cash incentive plan, administered under the CECP, and designed to drive and reward strong performance over aone-year period. Annually, the Committee establishes the performance objectives, threshold, target and maximum performance levels, and the related threshold, target and maximum AIP opportunities for each NEO, expressed as a percentage of base salary. Target incentive opportunity levels for the NEOs are intended to approximate the median of the target bonus potential for similarly situated executives in comparable companies. Maximum incentive opportunities are set at 200% of target. (3) | Salary adjustment reflects Mr. Caldwell increased role and responsibilities due to his promotion to EVP, Property & Casualty
|
For 2017, there were four performance measures, with 50% of the award based on Company-wide net operating income, and the remaining 50% divided among specific sales and premiums of the different business lines: P&C net written premium (20%), retirement sales (20%), and life sales (10%), as shown in the chart below. This provides a balance between shareholder return and growth, while complementing the longer-term LTIP metrics, which focus on long-term shareholder value creation. 2017 Annual Incentive Plan Performance Measures | | | 18 | | 2016Adjusted Operating Income - Operating income (GAAP net income after tax, excluding realized investment gains and losses other than those for Fixed Indexed Annuity related options and embedded derivatives) adjusted for P&C catastrophe costs different than the annual Plan, Annuity & Life deferred acquisition costs (“DAC”) unlocking and change in guaranteed minimum death benefit (“GMDB”) reserve due to capital gains and losses and market performance different than Plan, the impact on investment income of share repurchases different than Plan, and debt structure/costs including debt retirement different than Plan. P&C Net Premium Written (GAAP) - Amount charged for property and casualty policies issued during the year. (Portions of such amounts may be earned and included in financial reports over future periods.) Retirement Sales - The amount of new business from the sales of Horace Mann annuity products, from Horace Mann and independent agents, as measured by premiums and deposits to be collected over the 12 months following the sale. Life Sales - The amount of new Horace Mann individual life insurance products sold during the year, as measured by premiums and deposits to be collected over the 12 months following the sale. |
All the NEOs’ 2017 annual incentive amounts are based on the same corporate and business line objectives to promote cooperation. The targets for the operating income and sales or premium | | | | 26 | | 2018 Proxy Statement • Compensation Discussion and Analysis |
measures were based on a review of market conditions and expectations of other companies in the industry as well as our financial plan for 2017 (“2017 Plan”). The 2017 Plan was the basis of our 2017 earnings guidance, which was publicly disclosed in February 2017 in connection with our release of earnings for the year ended December 31, 2016. The Committee believes that tying the AIP to Company performance provides appropriate alignment for an executive’s compensation as it recognizes that the Company as a whole must perform well in order to deliver value to our Shareholders. Further, tying all the NEOs’ AIP awards to the performance of specific business lines incentivizes cooperation among the business line leaders. It is the goal of the Committee to establish measurements and targets that are reasonable, but not easily achieved. The measures and targets are discussed with the CEO, other NEOs, other members of the Board and CAP before they are set. Each March, the Committee certifies performance and determines AIP payouts for the prior year. Based on the 2017 results of 95.46% of target for Ms. Zuraitis and the other NEOs, the 2017 AIP payouts (paid in March 2018) were as follows: | | | | | | | | | | | | | | | | | | | | | | | | | | | | | | | | | | | | 2017 AIP Measures (in $M) | | Threshold | | Target | | Maximum | | Actual | | Results | | Weighting | | Payout | Adjusted Operating Income | | | | 77.9 | | | | | 83.8 | | | | | 92.5 | | | | | 87.2 | | | | | 139 | % | | | | 50 | % | | | | 69.48 | % | P&C Net Premium Written | | | | 651.7 | | | | | 662.7 | | | | | 673.7 | | | | | 662.8 | | | | | 101 | % | | | | 20 | % | | | | 20.18 | % | Horace Mann Retirement Sales | | | | 422.3 | | | | | 435.3 | | | | | 448.3 | | | | | 367.3 | | | | | 0 | % | | | | 20 | % | | | | 0.00 | % | Horace Mann Life Sales | | | | 17.6 | | | | | 18.5 | | | | | 19.4 | | | | | 17.74 | | | | | 58 | % | | | | 10 | % | | | | 5.80 | % | Total | | | | | | | | | | | | | | | | | | | | | | | | | | | | | 100 | % | | | | 95.46 | % |
| | | | | | | | Named Individual | | 2017 Target
AIP Opportunity1 | | 2017 Actual
AIP Payout | | 2017 Actual AIP Payout
as a % of Base Salary | Marita Zuraitis | | 100% | | $803,455 | | 94.52% | Bret A. Conklin | | 35%/50% | | $134,200 | | 41.94% | Matthew P. Sharpe | | 60% | | $236,264 | | 56.93% | William J. Caldwell | | 60% | | $212,398 | | 56.64% | Donald M. Carley | | 40% | | $114,552 | | 38.18% |
(1) Mr. Conklin’s Target AIP Opportunity was increased to 50% upon his promotion to EVP & CFO
| | | | 2018 Proxy Statement • Compensation Discussion and Analysis | | 27 |
Long-term Incentive Plan The Company awards long-term incentives to NEOs and other executives who can have the greatest impact on the Company’s long-term success. Long-term incentives are intended to focus executives on driving operating performance as well as long-term value creation. They are also an effective vehicle for attracting and retaining executive talent. All long-term incentive grants are made under the Company’s CECP. As discussed previously, the Company’s Long-term Incentive Plan is comprised of three vehicles, performance-based RSUs, service-based RSUs and stock options. 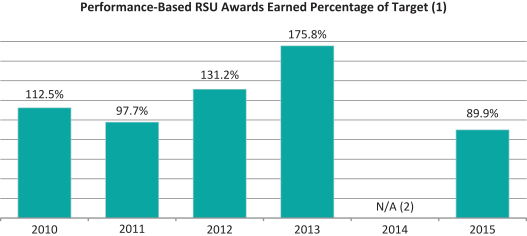
N/A – Not applicable
(1) | Graph represents percent of target performance-based awards earned in the year the long-term incentive measurement period ended. Performance-based RSUs comprise 45-50% of the total long-term incentive opportunity.
|
(2) | Due to the Company adopting a three-year performance period in 2013, the performance period ended in 2015 and no long-term period ended in 2014.
|
In setting targets for performance-based RSUs under the Long-term Incentive Plan, the Committee considers, among other things, the external competitive and financial markets environment, the strategic goals of the Company, internal financial projections, and the difficulty of meeting those goals and projections. For the five most recently completed performance periods, awards earned under the Long-term Incentive Plan have ranged from approximately 90% to 176% of target, with an annual average of 121.4% of target for the performance periods, as illustrated in the graph above.
The variability and average level of the awards earned confirms the Committee’s practice of establishing reasonable yet aggressive goals for the Company’s Long-term Incentive Plan.
The intent of the programour LTIP is to focus executives on shareholder value and key strategic objectives, while promoting retention and recognizing the market trend to deliver long-term incentives through a mix of equity-based compensation vehicles. Further, in combination with the cash component of the Annual Incentive Plan (“AIP”), the compensation program provides a meaningful incentive without encouraging excessive risk taking. To ensure that our executives’ interests are aligned with those of our Shareholders, our executives are required to defer earned and vested RSU awards until their stock ownership requirements are met.
retention. | | | 2016 Proxy Statement • Compensation Discussion and Analysis | | 19 |
Long-term Incentive Plan Design and2017 LTIP Aggregate Target Setting
2013-2015 Long-term Incentive Plan Grants and Awards
The 2013 awards were 100% equity-based and were comprised of 50% performance-based RSUs, 20% service-based RSUs and 30% service-based stock options. All measures were defined as relative, specified performance levels measured against a peer group of companies. The peer group of companies was made up of all insurance companies included in the Russell 2000® Index, except for brokerages, reinsurance, financial guarantee and health companies. The performance measures and targets for the performance-based RSUs were as follows:
| | | | | | | | | | | | | | | | | 2013-2015 Performance Measures (1) | | Measurement Weighting | | | 2013-2015 Performance Period Targets | | 2013-2015 Performance Period Results | | 2013-2015 Performance Period Weighted
Results | | | Absolute vs. Relative | | Operating Earnings per Share Growth | | | 30 | % | | 50th Percentile of Peer Group | | Below Threshold | | | 0.00 | % | | | Relative | | Operating Return on Equity | | | 30 | % | | 50th Percentile of Peer Group | | 59th Percentile of Peer Group | | | 36.90 | % | | | Relative | | Total Shareholder Return | | | 40 | % | | 50th Percentile of Peer Group | | 63rd Percentile of Peer Group | | | 53.06 | % | | | Relative | | Total | | | 100 | % | | | | | | | 89.96 | % | | | | |
| (1) | The Performance Measures, as defined under the Long-term Incentive Plan, include:
|
| • | | Operating Earnings per Share Growth – Relates to the total percentage increase or decrease in Operating Earnings per share for the three-year period measured against a peer group of companies in the Russell 2000® Index.
|
| • | | Operating Return on Equity – Relates to the average annual Operating Income return on average equity for the three-year period measured against a peer group of companies in the Russell 2000® Index.
|
| • | | Total Shareholder Return – Relates to the Total Shareholder Return for the three-year period measured against a peer group of companies in the Russell 2000® Index.
|
2014-2016 Long-term Incentive Plan Grants and Awards
The 2014 awards were 100% equity-based and were comprised of 50% performance-based RSUs, 20% service-based RSUs and 30% service-based stock options. All measures are defined as relative, specified performance levels measured against a peer group of companies. The peer group of companies is made up of all insurance companies included in the Russell 2000® Index, except for brokerages, reinsurance, financial guarantee and health companies. The two relative performance measures for the 2014-2016 performance period – operating return on equity and total shareholder return – continue to support the objective of out-performing our peers as the Company focuses on investments needed in these three years to allow for strategic growth. These two measures focus on the effective use of capital and delivering on growth objectives while retaining our strong alignment with Shareholder interests. The performance measures and targets for the performance-based RSUs are as follows:
| | | | | | | 2014-2016
Performance Measures (1)
| | Measurement
Weighting
| | 2014-2016
Performance Period Targets
| | Absolute
vs. Relative
| Operating Return on Equity
| | 50% | | 50th Percentile of Peer Group | | Relative | Total Shareholder Return
| | 50% | | 50th Percentile of Peer Group | | Relative | Total
| | 100% | | | | |
(1) | The Performance Measures, as defined under the Long-term Incentive Plan, include:
|
| • | | Operating Return on Equity – Relates to the average annual Operating Income return on average equity for the three-year period measured against a peer group of companies in the Russell 2000® Index.
|
| • | | Total Shareholder Return – Relates to the Total Shareholder Return for the three-year period measured against a peer group of companies in the Russell 2000® Index.
|
| | | 20 | | 2016 Proxy Statement • Compensation Discussion and Analysis |
2015-2017 Long-term Incentive Plan Grants and Awards
| | | | | | | The 2015 awards were 100% equity-based and were comprised of 50% performance-based RSUs, 20% service-based RSUs and 30% service-based stock options. The 2015-2017 performance measures are comprised of two relative measures and one absolute measure. The third measure is absolute and reflects the company’s focus on year over year premium growth in all lines of business. Together, these three measures support our long term strategy to continue our effective use of capital, increasing and sustaining our momentum in profitable multiline premium growth while retaining our strong alignment with Shareholder interest. The performance measures and targets for the performance-based RSUs are as follows:
| | | | Peer Group for Relative Measures
• Russell 2000® Index (except for brokerage, reinsurance, financial guarantee and health companies)
| | | | | | | | | | | | | | | | | | | | |
| | | | | | | 2015-2017 Performance Measures (1) | | Measurement Weighting | | 2015-2017 Performance Period Targets | | Absolute vs. Relative | Operating Return on Equity | | 40% | | 50th Percentile of Peer Group | | Relative | Total Shareholder Return | | 40% | | 50th Percentile of Peer Group | | Relative | Total Written Premium Growth | | 20% | | 3% | | Absolute | Total | | 100% | | | | |
| (1) | The Performance Measures, as defined under the Long-term Incentive Plan, include:
|
| • | | Operating Return on Equity – Relates to the average annual Operating Income return on average equity for the three-year period measured against a peer group of companies in the Russell 2000® Index.
|
| • | | Total Shareholder Return – Relates to the Total Shareholder Return for the three-year period measured against a peer group of companies in the Russell 2000® Index.
|
| • | | Total Written Premium Growth – Relates to Horace Mann written premium growth measured as the compound annual growth rate from 2014 to 2017 for Auto, Property, Annuity and Life.
|
Long-term Incentive Target for Period beginning in 2014Opportunity
In setting the dollar values of the 2014 and 2015 long-term incentive2017 opportunities under LTIP for each NEO, the Committee targeted amounts that would achieve the Company’s overall objective of positioning total compensation at approximately the market median. The 2014 and 20152017 target grant values for the NEOs for the 2014-2016 and 2015-2017 performance periods were as follows: | | | | | | | | | Name | |
| Long-term Incentive
Target in 2014 |
| |
| Long-term Incentive
Target in 2015 |
| Marita Zuraitis | | | $1,000,000 | | | | $1,100,000 | | Dwayne D. Hallman | | | $500,000 | | | | $500,000 | | Matthew P. Sharpe | | | $400,000 | | | | $500,000 | | William J. Caldwell | | | $175,000 | | | | $300,000 | | Kelly J. Stacy | | | N/A (1) | | | | $300,000 | |
N/A – Not applicable
| | | | | Named Individual | | 2017 LTIP
Target | | Marita Zuraitis | | | $1,550,000 | | Bret A. Conklin | | | $280,000 | | Matthew P. Sharpe | | | $565,000 | | William J. Caldwell | | | $360,000 | | Donald M. Carley | | | $285,000 | |
2017 LTIP Award Vehicles For 2017, LTIP is comprised of three vehicles, as illustrated in the chart below: (1) performance-based RSUs; (2) service-vested RSUs; and (3) service-vested stock options. | | | | | Performance-based RSUs - Earned over a three-year period, based upon Relative and Absolute Measures. If any shares are earned at the end of the three-year performance period, the executive fully vests in the award | | | (1)Service-vested RSUs - Vest ratably over 3 years | | Mr. Stacy was hired in 2015.
Stock options - Granted at fair market value with a 10 year life; options vest ratably over 4 years |
Performance-Based RSUs (PBRSUs) We believe the RSUs are The Committee believes that PBRSUs provide an effective vehicle for rewarding executives based on a three-year performance and haveperiod. Each year, a high value in promoting executive retention. RSUsnew three-year period starts, partially overlapping the periods that started the prior two years. PBRSUs were granted on March 5, 20137, 2017 for the 2013-20152017-2019 performance period, on March 5, 2014 forand comprise 50% of the 2014-2016 performance period, on March 4, 2015 for the 2015-2017 performance period.2017 LTIP opportunity. These RSUs will be earned and vested on December 31, 2015, December 31, 2016, and December 31, 2017, respectively,2019, based on achievements relative to the three-yearlevel of achievement, though no RSUs will be earned if threshold level of performance period targets. Participants can earn up to 200% of their target award of RSUs based on performance. For the 2013-2015 program, the RSUs earned at the end of 2015 were 100% vested on January 1, 2016 following the performance period. Under the 2014-2016 program, any RSUs earned at the end of 2016 are 100% vested on January 1, 2017 following the performance period. Under the 2015-2017 program, any RSUs earned at the end of 2017 are 100% vested on January 1, 2018 following the performance period. Once vested, the RSUs are subject to holding requirements until the executive’s stock ownership requirements are met. See “Stock Ownership and Holding Requirements.”is not achieved. From the date of grant, RSUsPBRSUs accrue dividendsdividend equivalents at the same rate as dividends paid to our Shareholders,shareholders, but the dividend equivalents are only paid on the corresponding shares that are earned. If no shares are earned, the dividendsdividend equivalents are forfeited. Earned dividendsdividend equivalents are converted into additional RSUs. Target RSU opportunities for the 2013-2015, 2014-2016, and 2015-2017 performance periods for the NEOs were established as 50% of the total long-term incentive opportunities. On an annualized basis, the awards of RSUs ranged from approximately 35% to 73% of base salary. Maximum opportunities were set at 200% of target and threshold opportunities were set at 50% of target.
Each of the relative performance measures are required to be at or above the 25th percentile to earn an award. At the 25th percentile, participants can earn 50% of their target award.
| | | 2016 Proxy Statement • Compensation Discussion and Analysis | | 21 |
Service-BasedService-vested RSUs We believe service-based
The Committee believes that service-vested RSUs like stock options, provide strong alignment with Shareholder interests and a long-term focus for our executives and assist in the retention of key executive talent. Service-basedService-vested RSUs were granted on March 4, 20157, 2017 and comprise 20% of the long-term incentive2017 LTIP opportunity. For the 2015-2017 award, service-basedService-vested RSUs vest 33% after the first year, vest an additional 33% after the second year and vest the final 34% after the third year in each casefrom the grant date, and are subject to continued employment to the vesting date. Once vested, the RSUs are subject to a holding requirement until the executive’s stock ownership requirements are met. See “Stock Ownership and Holding Requirements.” From the date of the grant, the RSUs accrue dividendsdividend equivalents at the same rate as dividends paid to our Shareholders. These dividendsdividend equivalents are converted into additional RSUs and vest when the underlying RSUs vest. | | | | 28 | | 2018 Proxy Statement • Compensation Discussion and Analysis |
Stock Options We believe The Committee believes that stock options provide strong alignment with Shareholder interests, as participantsexecutives do not realize any value unless our stock price appreciates. They also promote retention. Stock options granted under the Long-term Incentive PlanLTIP have an exercise price equal to the closing stock price on the date of grant, vest ratably over a four-year period subject to continued employment toon each vesting date and have aten-year term. In determining the number of stockStock options were granted on March 4, 2015, we divided7, 2017 and comprise 30% of the total target long-term incentive opportunity by2017 LTIP opportunity. Beginning with the 2017 LTIP grant, the Company transitioned from a blend of Incentive Stock Options (ISO) andNon-qualified Stock Options (NQSO) to all NQSOs. The number of options granted was determined using the Black-Scholes value of an option.valuation method. For additional information regarding assumptions used for these valuations, see the Company’s 20152017 Annual Report onand Form10-K “Notes to Consolidated Financial Statements – Note 1 – Summary of Significant Accounting Policies – Share-Based Compensation.” Beginning with the options granted March 9, 2011, uponUpon exercise Executive Officers are required to hold shares equivalent to any proceeds (net of exercise price and related taxes and the costs of the exercise) for a minimum of twelve months. Timing of Equity Grants The Committee has granted long-term incentives only at its regularly scheduled Board meetings. The Company uses the closing stock price on the date of the grant to determine the exercise price for stock options. For regularly scheduled annual awards or for awards pursuant to the Long-term Incentive Plan, the grant effective date is the approval date of the applicable resolution as approved or a future date as otherwise specified in the duly authorized resolution. For other awards, 2017-2019 Performance-based RSUs The Performance-based RSUs granted in 2017 have three performance measures as shown below: | | | | | Relative Total Shareholder Return - Relative Total Shareholder Return for the three-year period measured against a peer group of companies. Relative Operating Return on Equity - Average annual relative Operating Income return on average equity for the three-year period measured against a peer group of companies. Total Revenue Growth - Measured as the CAGR over the period 12/31/2016 to 12/31/2019 for Written Premium Growth for HMN auto, property, and life and total retirement sales for annuity (HMN, RIA and institutional platform) and HMGA. |
Prior Years PBRSU Grants 2016-2018 PBRSUs The PBRSUs granted in 2016 will not mature until December 31, 2018. Since the grant effective dateapplicable3-year performance period has not yet ended, actual performance against targets is not yet known. | | | | 2018 Proxy Statement • Compensation Discussion and Analysis | | 29 |
2015-2017 PBRSUs The performance-based RSUs granted in 2015 matured and vested as of December 31, 2017. The performance measures, targets and payout levels for the first business dayPBRSUs granted in 2015 are as follows: | | | | | | | | | | | | | | | | Measures | | Threshold (2) | | Target (2) | | Maximum (2) | | Weighting | | | Weighted Result
at 12/31/2017 | | Relative(1) Measures | | | | | | | | | | | | | | | TSR(3) | | 25th
Percentile
Ranking vs
Peer Co’s | | 50th
Percentile
Ranking vs
Peer Co’s | | 90th
Percentile
Ranking vs
Peer Co’s | | | 40% | | | | 46% | | Operating ROE(4) | | 25th
Percentile
Ranking vs
Peer Co’s | | 50th
Percentile
Ranking vs
Peer Co’s | | 90th
Percentile
Ranking vs
Peer Co’s | | | 40% | | | | 53% | | Absolute Measure | | | | | | | | | | | | | | | Total Written Premium Growth(5) | | 2% | | 3% | | 5% | | | 20% | | | | 19% | | | | | | | | | | | | | | | 118% | |
Notes: | (1) | Peer group comprised of Russell 2000 Index insurance companies excluding brokerage, reinsurance, financial guarantee, and health companies. |
| (2) | Threshold award (25th percentile) is 50% of target LTI opportunity; Target award (50th percentile) is 100%; Maximum (90th percentile) is 200% of target. Awards for results between Threshold-Target and Target-Maximum will be interpolated. |
| (3) | Total Shareholder Return for the 3 year period. Measures from the average price 5 trading days before and 5 trading days after the beginning of the measurement period (1/1/15) to the average price 5 trading days before and 5 trading days after the end of the measurement period (12/31/17). (Source: Bloomberg) |
| (4) | Average annual Operating Income Return on Average Equity (excluding FAS 115) for the 3 years. (Source: SNL) |
| (5) | Total Written Premium Growth - Measured as the CAGR over the period 12/31/2014 to 12/31/2017 for Written Premium Growth for HMN auto, property, and life and total retirement sales for annuity (HMN, RIA and institutional platform) and HMGA. |
Strategic Incentive Grants As disclosed in our 2016 and 2017 Proxy Statements, in March 2016, we made strategic equity grants to key executives, including four of the next securities trading window2017 NEOs, under our CECP. Each executive received a provisional equity grant of PBRSUs contingent on a corporate financial performance goal, earnings per share, and individual strategic goals. If the Performance Goal is satisfied, 50% of the award will be earned and vested on January 1, 2019. The remaining 50% of the award will also be eligible for vesting on January 1, 2019 subject to achievement of individual strategic goals. The individual goal-based PBRSUs: Do not vest unless the established byindividual strategic goals are achieved during the Company followingperformance period beginning on January 1, 2016, and ending on December 31, 2018; Are reduced to zero, if the approval date. Under no circumstances doescorporate performance goal is not achieved; Cannot exceed the grant effective date precedenumber of shares granted (except through accrued dividend equivalents); and Will be reduced if all individual strategic goals and their components are partially met. The entire award is subject to satisfaction of an objective threshold Company-wide performance goal, which must be met during the approval date ofperformance period beginning on January 1, 2016 and ending on December 31, 2018. If an unexpected event occurs triggering a given award.significant loss, the awards could be eliminated entirely. These 2016 awards are reflected in the 2016 data in the Summary Compensation Table. No strategic incentive equity awards were made in 2017. | | | | 30 | | 2018 Proxy Statement • Compensation Discussion and Analysis |
Additional Pay Practices Stock Ownership and& Holding RequirementsGuidelines Stock ownership requirements were established in 1998. Currently, our NEOsOur Executive Officers are required to satisfy meaningful stock ownership levels within five years of attaining their position. Stock ownership may be achieved by direct ownership or beneficial ownership through a spouse or child. The following types of beneficial ownership are considered in determining stock ownership: direct ownership of HMEC Common Stock, HMEC Common Stock held in the Company 401(k) Plan, HMEC deferred Common Stock equivalent unitsaccumulate and RSUs (vested and unvested). Outstanding stock options are not used in determining stock ownership. The CEO is required to maintain beneficial stock ownership with– calculated as a book value of at least 500%percentage of base salary and all other NEOs are required to maintain beneficial stock ownership with a- as displayed in the table below:
| | | Position | | Stock
Ownership
Target % | CEO | | 500% | Executive Vice President | | 350% | Senior Vice President | | 300% | Controller | | 200% |
We use book value of at least 350% of base salary. Given the volatility of the stock market in recent years, we have migrated to an approach wherebymeasure the value of the shares requiredwe require the NEOs to be owned is based on the Company’s book value, not stock price, asown because book value is less volatile than stock price. For this purpose, the Company’s book value per share is determined by dividing total shareholders’Shareholders’ equity, less the fair value adjustment for investments, by the number of outstanding shares of common stock. ForThe NEOs must satisfy stock ownership guidelines within five years of attaining their position. Stock ownership may be achieved by direct ownership or beneficial ownership, including shares held through the Horace Mann 401(k) Plan and RSUs (vested and unvested), as well as beneficial ownership through a spouse, child, or trust. Outstanding stock options granted after 2010,are not used in determining stock ownership.
Beginning with stock option grants made in 2011, NEOs are also required to hold shares equivalent to any proceeds from a long-term incentive stock option exercise, net of exercise price and related taxes and the costs of the exercise, for a minimum of twelve months after the date of exercise. As part of its 2017 overall review of the executive compensation program, the Committee reviewed the stock ownership guidelines for the Executive Officers, and determined they were appropriate and will be continued in 2018. As indicated in the following chart, all NEOs have met or exceeded their stock ownership requirementsguidelines except for Mr. Caldwell andCarley. Mr. Stacy. Mr. Caldwell has been withCarley joined the Company less than three yearsin January 2016, and Mr. Stacy has been with the Company less than one year. Mr. Caldwell and Mr. Stacy areis on target to meet the requirement by their respective deadlines.the deadline. 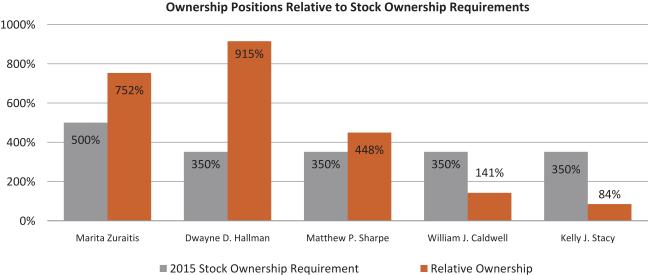
| | | 22 | | 20162018 Proxy Statement • Compensation Discussion and Analysis | | 31 |
| | | | | | | | | | | | | | Name | | 2015 Stock Ownership | | | 2015 Book Value (1) | | | | | Marita Zuraitis | | | 210,032 | | | $ | 5,641,460 | | | | | Dwayne D. Hallman | | | 151,278 | | | $ | 4,063,327 | | | | | Matthew P. Sharpe | | | 66,726 | | | $ | 1,792,260 | | | | | William J. Caldwell | | | 18,383 | | | $ | 493,767 | (2) | | | | Kelly J. Stacy | | | 9,351 | | | $ | 251,168 | (2) |
| | | | | | | | | | Named Individual | | Stock
Ownership
Target % | | Stock
Ownership
Actual % | | Stock
Ownership (1) | | Book
Value (2) | Marita Zuraitis | | 500% | | 1139% | | 328,113 | | $9,682,616 | Bret A. Conklin | | 350% | | 590% | | 63,982 | | $1,888,121 | Matthew P. Sharpe | | 350% | | 832% | | 117,055 | | $3,454,300 | William J. Caldwell | | 350% | | 385% | | 48,921 | | $1,443,671 | Donald M. Carley | | 300% | | 107% | | 10,846 | | $ 320,061 | HMN Stock Price @ 12/31/2017 = | | $44.10 | HM Book Value @ 12/31/2017 = | | $29.51 |
| (1) | Based on the Company’s December 31, 2015Represents share ownership as of 12/31/17
|
| (2) | Represents book value per share excluding the fair value adjustment for investments of $26.86. |
| (2) | Mr. Caldwell’s length of service with the Company is less than three years. Mr. Stacy’s length of service is less than one year.
|
Minimum Vesting Period In 2017, through an amendment approved by the Board, the Company updated the CECP to reflect a minimum vesting period of one year for all equity grants. No portion of any equity grant, including stock options, stock appreciation rights, restricted stock or RSUs, will become vested before the first anniversary of the grant date except in the cases of death or disability. Annual Incentive PlanPerformance and Pay Review To further reinforce a performance-based culture and the tie between Company results and compensation, the Committee reviews each Executive Officer’s performance annually, coinciding with the review of corporate performance results. Each Executive Officer is reviewed not only on prior year business results but also on the individual’s demonstration of leadership skills and progress on specific strategic initiatives and other key priorities. The Committee also considers any adjustments to base salary, annual incentive opportunity, and long-term incentive opportunity at this review. The Committee recognizes the need to have market-competitive compensation opportunities to attract, retain, and reward high performing executive talent. Risk Assessment Our Annual Incentive Plan (“AIP”)programs are structured to discourage excessive risk-taking through a balanced use of compensation vehicles and metrics with an overall goal of delivering sustained long-term Shareholder value while aligning our executives’ interests with those of our Shareholders. To this end, management and CAP conduct, and the Committee and the Board’s outside legal counsel reviews, an annual risk analysis of the compensation plans and incentive metrics. Our executive compensation program requires that a substantial portion of each Executive Officer’s compensation be contingent on delivering performance results. In addition, a significant portion of our NEOs’ compensation is designed to drive and reward strong performancedelivered in equity over a one-year period.multi-year timeframe. The annualCommittee has been advised by the Board’s outside legal counsel that no unreasonable risk exists that a compensation policy or incentive isplan would have a key part of our overall compensation structurematerial adverse impact on the Company, and is directly linked tothe Board agrees with this risk assessment. Succession Planning Process To mitigate enterprise risk and leadership gaps, the Committee oversees and monitors the Company’s annual business plan. Undersuccession planning process on a regular basis. This process identifies candidates that have the Company’s CECP, the Committee establishes Company-wideskill sets, background, training, and business unit/division performance objectives every March, as well as the related threshold, targetindustry knowledge to assume critical positions on an emergency basis and maximum bonus opportunities for each NEO. In setting these objectives and opportunities, the Committee considers, among other things, the strategic goals of the Company, corporate financial projections and the degree of difficulty in achieving the targets. It is the goal of the Committee to establish measurements and targets that are reasonable, but not easily achieved. As evidence of this, the AIP has generated awards ranging from approximately 102% to 172% of target over the past 5 years, with an average of approximately 135%also for the five-year period. During this period,long-term, if necessary. The Company’s succession plan is also reviewed by the Company has consistently maintained strong earnings and dividend growth that has provided solid total shareholder returns. The variability and average level of the awards earned confirm the Committee’s practice of establishing reasonable yet aggressive goals for the Company’s AIP. The measures and targets are discussed with the CEO, other NEOs, other members of thefull Board and CAP before they are set. Each March, the Committee also certifies performance and determines annual incentive award payouts for the prior year. 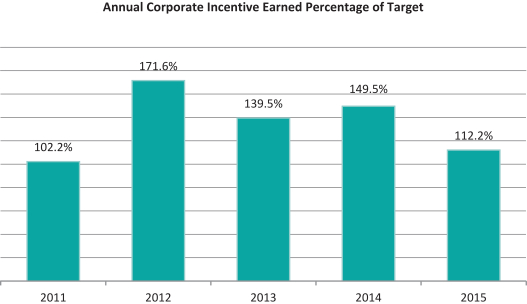
Target incentive opportunities for the NEOs are intended to approximate the median of the target bonus potential for similarly situated executives in comparable companies. Maximum incentive opportunities are set at 200% of target. Changes made to these opportunities, if any, generally take effect for the next fiscal year. Based on the 2015 performance of the Company relative to the Corporate Measures described below, the Committee approved the resulting award of 112.2% of target for Ms. Zuraitis and the other NEOs. The annual incentives paid to the NEOs are shown in the Non-Equity Incentive Plan Compensation column of the “Summary Compensation Table.” For 2015, the target annual incentive opportunities for the NEOs, the actual AIP paid (112.2% of target) along with the actual AIP payment expressed as a percentage of base salary as of December 31, 2015, were as follows:
| | | | | | | | | | | | Name | | 2015 Target AIP Opportunity | | 2015 Actual AIP Paid | | | 2015 Actual AIP Paid as a Percent of Salary | | Marita Zuraitis | | 90% | | $ | 749,809 | | | | 99.97 | % | Dwayne D. Hallman | | 60% | | $ | 298,981 | | | | 67.34 | % | Matthew P. Sharpe | | 60% | | $ | 265,312 | | | | 66.33 | % | William J. Caldwell | | 45% | | $ | 164,136 | | | | 46.90 | % | Kelly J. Stacy | | 40% | | $ | 134,676 | | | | 44.89 | % |
| | | 201632 | | 2018 Proxy Statement • Compensation Discussion and Analysis | | 23 |
For 2015, 100%Minimal Use of Employment Agreements
The Company does not have any individual employment agreements with any Executive Officer and intends to continue to minimize their use, while recognizing that in isolated situations an agreement may be needed for attraction and retention of key executive talent. Executive Severance and Change in Control Plans To maintain market competitiveness and allow for the CEO’s and all other NEOs’ annual incentive opportunities were tied to Company-wide performance. The Committee believes that tying this incentive to Company performance provides appropriate alignment for an executive’s compensation as it recognizes thatsuccessful recruitment of key executives, the Company as a whole must perform wellmaintains the Horace Mann Service Corporation Executive Severance Plan (“Executive Severance Plan”) and the Horace Mann Service Corporation Executive Change in order to deliver value to our Shareholders. Annual IncentiveControl Plan Targets
The Committee finalized targets for the 2015 corporate performance measures in its March 2015 meeting. The targets for the Operating Income and Insurance Sales measures were based on a review of market conditions and expectations of other companies in the industry as well as our financial plan for 2015 (“CIC Plan”). The financialExecutive Severance Plan provides benefits due to loss of position with or without a change in control. The CIC Plan is intended to provide a level of security consistent with market practices, mitigate some of the conflicts an executive may be exposed to in a potential acquisition or merger situation, and serve to ensure a more stable transition if a corporate transaction were to occur. The CIC Plan provides for benefits only in the event of the loss of position following a change in control (i.e., double trigger), as defined in the CIC Plan. Participants in the CIC Plan are designated by position. This plan wasdoes not have taxgross-up provisions. Currently, all of the basisNEOs participate in the Executive Severance and CIC Plans. The CIC Plan does not permit duplicate benefits under the Executive Severance Plan.
The multiple of our 2015 earnings guidance, which was publicly disclosedthe sum of salary plus target annual incentive, payable in February 2015the form of salary continuation (for the Executive Severance Plan), and payable in connection with our release of earnings fora lump sum (for the year ended December 31, 2014. All measures are defined as absolute (meeting specific established internal goals, i.e.CIC Plan), earnings, revenues and sales). For 2015,is set forth in the corporate measures (“Corporate Measures”), bonus targets and results were as follows:following table: | | | | | | | | | | | | | | | | | | | | | Annual 2015 Corporate Measures (1) | | Measurement Weighting | | | Target | | | Results | | | Actual Weighted Results | | | Absolute vs. Relative | | Adjusted Operating Income | | | 50 | % | | $ | 92.9 million | | | $ | 93.4 million | | | | 52.30 | % | | | Absolute | | P&C Net Premium Written | | | 20 | % | | $ | 603.0 million | | | $ | 605.8 million | | | | 25.60 | % | | | Absolute | | Horace Mann Annuity Sales | | | 20 | % | | $ | 362.1 million | | | $ | 370.7 million | | | | 34.33 | % | | | Absolute | | Horace Mann Life Sales | | | 10 | % | | $ | 12.1 million | | | $ | 10.8 million | | | | 0 | % | | | Absolute | | Total | | | 100 | % | | | | | | | | | | | 112.23 | % | | | | |
(1) | The Corporate Measures, as defined by the AIP, include:
|
Adjusted Operating Income—Operating income (GAAP net income after tax, excluding realized investment gains and losses other than those for FIA related options and embedded derivatives) adjusted for Property & Casualty (“P&C”) catastrophe costs different than Plan, Annuity & Life deferred acquisition costs (“DAC”) unlocking and change in guaranteed minimum death benefit (“GMDB”) reserve due to capital gains and losses and market performance different than Plan, the impact on investment income of share repurchases different than Plan, and debt structure/costs including debt retirement different than Plan.
P&C Net Premium Written (GAAP)—Amount charged for property and casualty policies issued during the year; portions of such amounts may be earned and included in financial reports over future periods.
Annuity Sales—The amount of new business from the sales of Horace Mann annuity products, from Horace Mann and independent agents, as measured by premiums and deposits to be collected over the 12 months following the sale.
Life Sales—The amount of new Horace Mann individual life insurance products sold during the year, as measured by premiums and deposits to be collected over the 12 months following the sale.
| | | | | | | | | | | | Multiple | | | | Named Individual | | Executive
Severance | | Change In
Control | | | | Marita Zuraitis | | 2.0 | | 2.5 | | | | Bret A. Conklin | | 1.5 | | 2.0 | | | | Matthew P. Sharpe | | 1.5 | | 2.0 | | | | William J. Caldwell | | 1.5 | | 2.0 | | | | Donald M. Carley | | 1.0 | | 1.0 |
Retirement Plans The NEOs participate in our Company-wide tax-qualified retirement plansHorace Mann 401(k) Plan and a supplemental defined contribution plan designed to provide benefits that cannot be provided under ourtax-qualified defined contribution plan because of variouscertain limitations imposed by the Internal Revenue Code. Each of these two plans includes a Company contribution and thecontribution. The amounts contributed for each NEO are included in the “Summary Compensation Table.” The Company’s intent is to provideThese types of plans that are customarily offered within our industry to enhance our ability to attract and retain executive talent.industry. No NEO participates in the Company’s defined benefit plan or supplemental defined benefit retirement plan because participation in those plans was limited to individuals hired prior to January 1, 1999 and all of our NEOs were hired after that date. We formerly maintained a money purchase pension plan, which was terminated in 2014. Deferred Compensation Prior to 2009, the Long-term Incentive Plan provided a performance-based cash component. To further encourage ownership of HMEC’s Common Stock, deferred compensation accounts were established thatLTIP permitted executives to defer their long-term cash incentives intocertain elective deferrals.Pre-2009 account balances are maintained in notional deferred Common Stock equivalent units. Deferred Common Stock equivalent units, which accrue dividendsdividend equivalents at the same rate as dividends paid to our Shareholders. These dividendsdividend equivalents are converted into additional deferred Common Stock equivalent units. No other investment options are provided. Perquisites and Personal Benefits
As of April 1, 2014 we discontinued all executive perquisitesMr. Conklin is the only NEO with the exception of limited financial planning services. The Company pays an annual retainer to a third-party service provider of $10,000 and an annual fee of $14,000 for each executive participating. Please see the “Summary Compensation Table” for further details.
Tax Implications
Favorable accounting and tax treatment of the various elements of the Company’s total compensation program is an important, not the sole, consideration in the design of the compensation program. Section 162(m) of the Internal Revenue Code generally disallows a tax deduction to public corporations for compensation over $1,000,000 paid for any fiscal year to the corporation’s Chief Executive Officer and three other most highly compensated Executive Officers (other than the CFO) as of the end of the fiscal year. However, the statute exempts qualifying performance-based compensation from the deduction limit if certain requirements are met.
The Annual Incentive Plan and Long-term Incentive Plan are designed to permit full deductibility and the Committee expects all compensation to be fully deductible. However, the Committee believes that Shareholder interests are best served by not restricting the Committee’s discretion and flexibility in developing compensation programs, even though such programs may result in certain non-deductible compensation expenses. In
| | | 24 | | 2016 Proxy Statement • Compensation Discussion and Analysis |
order to satisfy the Section 162(m) qualification requirements, the Committee allocated an incentive pool equal to 4% of adjusted operating income to certain individualsaccount balance under the Company’s compensation program. Once the amount of the pool and the specific allocations are determined at the end of the year, the Committee can apply “negative discretion” to reduce (but not increase) the amount of any award payable from the incentive pool to individuals, as determined by the amount payable to each individual based on performance criteria and actual results.
Executive Severance and CIC Plans
To maintain market competitiveness and allow for the successful recruitment of key executives, the Company adopted the Horace Mann Service Corporation Executive Severance Plan and the Horace Mann Service Corporation Executive CIC Plan. The Executive Severance Plan provides benefits due to loss of position with or without a Change in Control. Currently, all NEOs participate in the Executive Severance Plan. The Executive CIC Plan provides for benefits only in the event of the loss of position following a “Change-in-Control” and only includes those positions that typically would be at risk in the event of a change of control or which are integral to negotiating a transaction. This plan does not have tax gross-up provisions. Currently, Ms. Zuraitis, Mr. Sharpe, Mr. Caldwell, and Mr. Stacy participate in the Executive CIC Plan. Those who participate in both the Executive Severance Plan and the Executive CIC Plan, or have individual CIC agreements, would not receive duplicate benefits.
Change in Control Agreements
The Company does have an individual severance agreement with Mr. Hallman. This agreement was entered into at the time of his employment and cannot be unilaterally changed. The agreement provides payments, benefits and tax gross-up provisions only if both a change in control of the Company and Mr. Hallman’s actual or constructive termination of employment occur (“double trigger”). The CIC agreement provision is described in “Potential Payments upon Termination or Change in Control.” The agreement is intended to provide a level of security consistent with market practices, mitigate some of the conflicts an executive may be exposed to in a potential acquisition or merger situation and serve to insure a more stable transition if a corporate transaction were to occur. The Company determined that it will not provide individual CIC agreements for future hires or renew existing individual CIC agreements.
Summary Compensation Table
The following table sets forth information regarding compensation of the Company’s Chief Executive Officer, Chief Financial Officer and three other most highly compensated Executive Officers, the NEOs, during 2015, 2014, and 2013.
| | | | | | | | | | | | | | | | | | | | | | | | | | | | | | | | | | | | | | Name | | Year | | | Salary ($) (1) | | | Bonus ($) (2) | | | Stock Awards ($) (3) | | | Option Awards ($) (4) | | | Non-Equity Incentive Plan Compensation ($) (5) | | | Change in Pension Value And Non- Qualified Deferred Compensation Earnings ($) | | | All Other Compensation ($) | | | Total ($) | | Marita Zuraitis | | | 2015 | | | | 742,333 | | | | 0 | | | | 770,000 | | | | 330,000 | | | | 749,809 | | | | 0 | | | | 55,587 | | | | 2,647,729 | | | | | | 2014 | | | | 690,500 | | | | 0 | | | | 700,000 | | | | 300,000 | | | | 929,068 | | | | 0 | | | | 45,609 | | | | 2,665,177 | | | | | | 2013 | | | | 413,750 | | | | 2,858,940 | | | | 560,000 | | | | 240,000 | | | | 500,063 | | | | 0 | | | | 192,174 | | | | 4,764,927 | | Dwayne D. Hallman | | | 2015 | | | | 444,000 | | | | 0 | | | | 350,000 | | | | 150,000 | | | | 298,981 | | | | 0 | | | | 28,000 | | | | 1,270,981 | | | | | | 2014 | | | | 440,502 | | | | 0 | | | | 350,000 | | | | 150,000 | | | | 329,275 | | | | 0 | | | | 30,200 | | | | 1,299,977 | | | | | | 2013 | | | | 403,642 | | | | 0 | | | | 350,000 | | | | 150,000 | | | | 281,540 | | | | 0 | | | | 29,797 | | | | 1,214,979 | | Matthew P. Sharpe | | | 2015 | | | | 394,000 | | | | 0 | | | | 350,000 | | | | 150,000 | | | | 265,312 | | | | 0 | | | | 41,508 | | | | 1,200,820 | | | | | | 2014 | | | | 354,252 | | | | 0 | | | | 280,000 | | | | 120,000 | | | | 264,803 | | | | 0 | | | | 36,053 | | | | 1,055,108 | | | | | | 2013 | | | | 318,756 | | | | 0 | | | | 210,000 | | | | 90,000 | | | | 222,332 | | | | 0 | | | | 25,528 | | | | 866,616 | | William J. Caldwell | | | 2015 | | | | 325,000 | | | | 0 | | | | 210,000 | | | | 90,000 | | | | 164,136 | | | | 0 | | | | 22,929 | | | | 812,065 | | | | | | 2014 | | | | 254,174 | | | | 0 | | | | 122,500 | | | | 52,500 | | | | 136,163 | | | | 0 | | | | 25,142 | | | | 590,479 | | | | | | 2013 | | | | 41,668 | | | | 220,000 | | | | 88,494 | | | | 37,926 | | | | 127,000 | | | | 0 | | | | 3,658 | | | | 518,746 | | Kelly J. Stacy | | | 2015 | | | | 130,769 | | | | 200,000 | | | | 310,000 | | | | 90,000 | | | | 134,676 | | | | 0 | | | | 44,287 | | | | 909,732 | |
(1) | Represents each NEO’s actual base salary paid for the years ended December 31, 2015, 2014 and 2013, respectively. Mr. Stacy was hired in July 2015.
|
(2) | For 2013, this represents sign-on awards for Ms. Zuraitis and Mr. Caldwell. For 2015, this represents sign-on awards for Mr. Stacy.
|
(3) | Represents the grant date fair value of service-based and performance-based RSUs granted in each year. Performance-based RSUs are valued based on the probable performance of Target with the potential of 50% to 200% being earned based on performance results. For 2015, this includes an additional sign-on award for Mr. Stacy.
|
(4) | Represents the grant date fair value of $11.15 per share for stock options granted on March 4, 2015. For Mr. Stacy, it represents the grant date fair value of $11.52 per share for stock options granted on September 29, 2015.
|
(5) | Represents the cash payout for the AIP earned in each year.
|
| | | 2016 Proxy Statement • Compensation Discussion and Analysis | | 25 |
Detail of All Other Compensation
The following table sets forth information regarding all other compensation paid to, or earned by, the NEOs during 2015.
| | | | | | | | | | | | | | | | Name | | Perquisites & Other Personal Benefits ($) (1) | | | Relocation ($) | | | Company
Contributions to Defined
Contribution
Plans ($) | | | Total ($) | Marita Zuraitis | | | 14,000 | | | | 0 | | | | 41,587 | | | 55,587 | Dwayne D. Hallman | | | 0 | | | | 0 | | | | 28,000 | | | 28,000 | Matthew P. Sharpe | | | 14,000 | | | | 0 | | | | 27,508 | | | 41,508 | William J. Caldwell | | | 0 | | | | 0 | | | | 22,929 | | | 22,929 | Kelly J. Stacy | | | 0 | | | | 38,114 | | | | 6,173 | | | 44,287 |
(1) | Includes use of a financial planning service to help minimize distractions and help ensure appropriate focus on Company responsibilities.
|
Grants of Plan-Based Awards
The following table sets forth information concerning the grant of the 2015 Annual Incentive, the grant of the 2015 Long-term Incentive for the 2015-2017 performance period, and the sign-on RSU grant made to Mr. Stacy. Actual payouts under the 2015 AIP are included in the “Summary Compensation Table.” Payouts for the 2015 Long-term Incentive grant and the determination of the actual RSUs earned will not occur until after the completion of the 2015-2017 performance period.
| | | | | | | | | | | | | | | | | | | | | | | | | | | | | | | | | | | | | | | | | | | | | | | | | | | | | | | | | | | | | | | | | | | | | | | | | | | | | | | | All Other Stock
Awards:
Number
of
Shares
of Stock or Units (#) | | | All Other Option Awards: Number of Securities
Underlying
Options (#) (4) | | | Exercise
or Base
Price of
Option
Awards ($/Sh) | | | Grant
Date Fair
Value of
Stock &
Option
Awards
($) (5) | | | | | | | | | | | | | | | | | | | | | | | | | | | | | | | | | | | | | | | | | | | | | | | | | | | | | | | | | | | | | | | | | | | Name | | Grant Date | | | Incentive
Plan (1) | | | Estimated Future Payouts Under Non-Equity Incentive Plan Awards (2) | | | | | Estimated Future Payouts Under Equity Incentive Plan Awards (3) | | | | | | | | | | Threshold ($) | | | Target ($) | | | Maximum ($) | | | | | Threshold
(#) | | | Target
(#) | | | Maximum
(#) | | | | | | Marita Zuraitis | | | | | | | AIP | | | | 334,050 | | | | 668,100 | | | | 1,336,200 | | | | | | N/A | | | | N/A | | | | N/A | | | | N/A | | | | N/A | | | | N/A | | | | N/A | | | | | | 3/4/2015 | | | | LTI | | | | N/A | | | | N/A | | | | N/A | | | | | | 8,501 | | | | 17,002 | | | | 34,004 | | | | N/A | | | | N/A | | | | $32.35 | | | | 550,015 | | | | | | 3/4/2015 | | | | LTI | | | | N/A | | | | N/A | | | | N/A | | | | | | N/A | | | | 6,801 | | | | N/A | | | | N/A | | | | N/A | | | | $32.35 | | | | 220,012 | | | | | | 3/4/2015 | | | | LTI | | | | N/A | | | | N/A | | | | N/A | | | | | | N/A | | | | N/A | | | | N/A | | | | N/A | | | | 29,596 | | | | $32.35 | | | | 330,026 | | Dwayne D. Hallman | | | | | | | AIP | | | | 133,200 | | | | 266,400 | | | | 532,800 | | | | | | N/A | | | | N/A | | | | N/A | | | | N/A | | | | N/A | | | | N/A | | | | N/A | | | | | | 3/4/2015 | | | | LTI | | | | N/A | | | | N/A | | | | N/A | | | | | | 3,864 | | | | 7,728 | | | | 15,456 | | | | N/A | | | | N/A | | | | $32.35 | | | | 250,001 | | | | | | 3/4/2015 | | | | LTI | | | | N/A | | | | N/A | | | | N/A | | | | | | N/A | | | | 3,093 | | | | N/A | | | | N/A | | | | N/A | | | | $32.35 | | | | 100,059 | | | | | | 3/4/2015 | | | | LTI | | | | N/A | | | | N/A | | | | N/A | | | | | | N/A | | | | N/A | | | | N/A | | | | N/A | | | | 13,452 | | | | $32.35 | | | | 150,004 | | Matthew P. Sharpe | | | | | | | AIP | | | | 118,200 | | | | 236,400 | | | | 472,800 | | | | | | N/A | | | | N/A | | | | N/A | | | | N/A | | | | N/A | | | | N/A | | | | N/A | | | | | | 3/4/2015 | | | | LTI | | | | N/A | | | | N/A | | | | N/A | | | | | | 3,864 | | | | 7,728 | | | | 15,456 | | | | N/A | | | | N/A | | | | $32.35 | | | | 250,001 | | | | | | 3/4/2015 | | | | LTI | | | | N/A | | | | N/A | | | | N/A | | | | | | N/A | | | | 3,093 | | | | N/A | | | | N/A | | | | N/A | | | | $32.35 | | | | 100,059 | | | | | | 3/4/2015 | | | | LTI | | | | N/A | | | | N/A | | | | N/A | | | | | | N/A | | | | N/A | | | | N/A | | | | N/A | | | | 13,452 | | | | $32.35 | | | | 150,004 | | William J. Caldwell | | | | | | | AIP | | | | 73,125 | | | | 146,250 | | | | 292,500 | | | | | | N/A | | | | N/A | | | | N/A | | | | N/A | | | | N/A | | | | N/A | | | | N/A | | | | | | 3/4/2015 | | | | LTI | | | | N/A | | | | N/A | | | | N/A | | | | | | 2,319 | | | | 4,637 | | | | 9,274 | | | | N/A | | | | N/A | | | | $32.35 | | | | 150,007 | | | | | | 3/4/2015 | | | | LTI | | | | N/A | | | | N/A | | | | N/A | | | | | | N/A | | | | 1,857 | | | | N/A | | | | N/A | | | | N/A | | | | $32.35 | | | | 60,074 | | | | | | 3/4/2015 | | | | LTI | | | | N/A | | | | N/A | | | | N/A | | | | | | N/A | | | | N/A | | | | N/A | | | | N/A | | | | 8,072 | | | | $32.35 | | | | 90,011 | | Kelly J. Stacy | | | | | | | AIP | | | | 60,000 | | | | 120,000 | | | | 240,000 | | | | | | N/A | | | | N/A | | | | N/A | | | | N/A | | | | N/A | | | | N/A | | | | N/A | | | | | | 9/29/2015 | | | | LTI | | | | N/A | | | | N/A | | | | N/A | | | | | | 2,245 | | | | 4,490 | | | | 8,980 | | | | N/A | | | | N/A | | | | $33.41 | | | | 150,011 | | | | | | 9/29/2015 | | | | LTI | | | | N/A | | | | N/A | | | | N/A | | | | | | N/A | | | | 1,797 | | | | N/A | | | | N/A | | | | N/A | | | | $33.41 | | | | 60,038 | | | | | | 9/29/2015 | | | | LTI | | | | N/A | | | | N/A | | | | N/A | | | | | | N/A | | | | N/A | | | | N/A | | | | N/A | | | | 7,816 | | | | $33.41 | | | | 90,012 | | | | | | 9/29/2015 | | | | Service | | | | N/A | | | | N/A | | | | N/A | | | | | | N/A | | | | 2,994 | | | | N/A | | | | N/A | | | | N/A | | | | $33.41 | | | | 100,030 | |
N/A – Not applicable
(1) | Service grant represents a sign-on award to Mr. Stacy.
|
(2) | Represents performance-based 2015 Annual Incentive.
|
(3) | Represents performance-based and service-based RSU portions of the 2015 Long-term Incentive grants.
|
(4) | Represents the stock option portion of the 2015 Long-term Incentive grant.
|
(5) | Totals equate to each NEO’s 2015 Long-term Incentive target amount and the service grant described in footnote (1). The fair value of stock options was determined using the Black-Scholes model.
|
| | | 26 | | 2016 Proxy Statement • Compensation Discussion and Analysis |
Outstanding Equity Awards at Fiscal Year End
The following table sets forth information regarding the exercisable and unexercisable stock options, as well as unvested RSUs held by each NEO at December 31, 2015.
| | | | | | | | | | | | | | | | | | | | | | | | | | | | | | | | | | | | | | | | | | | | Name | | Option Awards | | | | | Stock Awards (RSUs) | | | | | Number of Securities Underlying Unexercised Options (#) Exercisable | | | Number of Securities Underlying Unexercised Options (#) Unexercisable (1) | | | Option Exercise Price ($) | | | Grant Date | | | Option Expiration Date | | | | | Number of Shares or Units of Stock that Have Not Vested (#) (2) | | | Market Value of Shares or Units of Stock that Have Not Vested ($) (3) | | | Equity Incentive Plan Awards: Number of Unearned Shares, Units, or Other Rights that Have Not Vested (#) (4) | | | Equity Incentive Plan Awards: Market or Payout Value of Unearned Shares, Units, or Other Rights that Have Not Vested ($) (3) | | | | | Marita Zuraitis | | | 13,438 | | | | 13,438 | | | | 22.69 | | | | 05/22/13 | | | | 05/22/20 | | | | | | | | | | | | | | | | | | | | | | | | | | 8,324 | | | | 24,972 | | | | 28.88 | | | | 03/05/14 | | | | 03/05/24 | | | | | | | | | | | | | | | | | | | | | | | | | | 0 | | | | 29,596 | | | | 32.35 | | | | 03/04/15 | | | | 03/04/25 | | | | | | 67,234 | | | $ | 2,230,824 | | | | 54,979 | | | $ | 1,824,203 | | | | | Dwayne D. Hallman | | | 8,220 | | | | 0 | | | | 13.83 | | | | 03/03/10 | | | | 03/03/17 | | | | | | | | | | | | | | | | | | | | | | | | | | 19,800 | | | | 0 | | | | 17.01 | | | | 03/09/11 | | | | 03/09/18 | | | | | | | | | | | | | | | | | | | | | | | | | | 16,848 | | | | 5,616 | | | | 17.32 | | | | 03/07/12 | | | | 03/07/19 | | | | | | | | | | | | | | | | | | | | | | | | | | 9,248 | | | | 9,248 | | | | 20.60 | | | | 03/05/13 | | | | 03/05/20 | | | | | | | | | | | | | | | | | | | | | | | | | | 4,162 | | | | 12,486 | | | | 28.88 | | | | 03/05/14 | | | | 03/05/24 | | | | | | | | | | | | | | | | | | | | | | | | | | 0 | | | | 13,452 | | | | 32.35 | | | | 03/04/15 | | | | 03/04/25 | | | | | | 17,644 | | | $ | 585,428 | | | | 30,146 | | | $ | 1,000,244 | | | | | Matthew P. Sharpe | | | 11,232 | | | | 3,744 | | | | 17.32 | | | | 03/07/12 | | | | 03/07/19 | | | | | | | | | | | | | | | | | | | | | | | | | | 5,550 | | | | 5,550 | | | | 20.60 | | | | 03/05/13 | | | | 03/05/20 | | | | | | | | | | | | | | | | | | | | | | | | | | 3,330 | | | | 9,990 | | | | 28.88 | | | | 03/05/14 | | | | 03/05/24 | | | | | | | | | | | | | | | | | | | | | | | | | | 0 | | | | 13,452 | | | | 32.35 | | | | 03/04/15 | | | | 03/04/25 | | | | | | 11,900 | | | $ | 394,842 | | | | 23,270 | | | $ | 772,099 | | | | | William J. Caldwell | | | 1,594 | | | | 1,594 | | | | 30.24 | | | | 12/11/13 | | | | 12/11/20 | | | | | | | | | | | | | | | | | | | | | | | | | | 1,457 | | | | 4,371 | | | | 28.88 | | | | 03/05/14 | | | | 03/05/24 | | | | | | | | | | | | | | | | | | | | | | | | | | 0 | | | | 8,072 | | | | 32.35 | | | | 03/04/15 | | | | 03/04/25 | | | | | | 5,871 | | | $ | 194,800 | | | | 10,222 | | | $ | 339,166 | | | | | Kelly J. Stacy | | | 0 | | | | 7,816 | | | | 33.41 | | | | 09/29/15 | | | | 09/29/25 | | | | | | 4,827 | | | $ | 160,160 | | | | 4,524 | | | $ | 150,106 | |
(1) | Long-term Incentive stock option grants are service-based and all unexercisable options vest on each anniversary of the grant date at a rate of 25% of the original grant.
|
(2) | Represents the unvested service-based RSUs granted in 2011, 2012, 2013, 2014 and 2015.
|
(3) | Represents the value of the RSUs based on the closing stock price of $33.18 at December 31, 2015.
|
(4) | The performance-based RSUs granted in 2013 were not earned until the end of the 2013-2015 performance period. RSUs earned at the end of the performance period vested 100% in January 2016. The performance-based RSUs granted in 2014 will not be earned until the end of the 2014-2016 performance period. RSUs earned at the end of the performance period will vest 100% in 2017. The performance-based RSUs granted in 2015 will not be earned until the end of the 2015-2017 performance period. RSUs earned at the end of the performance period will vest 100% in 2018.
|
| | | 2016 Proxy Statement • Compensation Discussion and Analysis | | 27 |
Option Exercises and Stock Vested
The following table sets forth information regarding options exercised and stock awards acquired on vesting by the NEOs in 2015:
| | | | | | | | | | | | | | | | | | | | | | | | | | Option Awards | | | | | Stock Awards (RSUs) | | | | | Name | | Number of Shares
Acquired on
Exercise (#) | | | Value Realized
on Exercise ($) | | | | | Number of
Shares
Acquired
on Vesting (#) (1) | | | Value Realized
on
Vesting ($) (2) | | | | | Marita Zuraitis | | | 0 | | | | 0 | | | | | | 0 | | | | 0 | | | | | Dwayne D. Hallman | | | 0 | | | | 0 | | | | | | 0 | | | | 0 | | | | | Matthew P. Sharpe | | | 0 | | | | 0 | | | | | | 0 | | | | 0 | | | | | William J. Caldwell | | | 0 | | | | 0 | | | | | | 1,687 | | | | 55,097 | | | | | Kelly J. Stacy | | | 0 | | | | 0 | | | | | | 0 | | | | 0 | |
(1) | For Mr. Caldwell, it represents the number of shares vested and acquired as part of a RSU sign-on consideration.
|
(2) | The value realized on vesting of stock awards is determined by multiplying the number of shares vested by the closing stock price on the date of vesting. The actual amounts realized from vested stock awards will depend upon the sale price of the shares when they are actually sold.
|
Pension Benefits
The defined benefit plans (qualified and nonqualified) sponsored by the Company were amended to freeze participation to those who were hired prior to January 1, 1999. As all of the Company’s NEOs were hired subsequent to that date, they are not eligible to participate in the defined benefit plans.this arrangement.
Nonqualified Defined Contribution and Other Nonqualified Deferred Compensation Plans The Company previously offered a nonqualified deferred compensation plan to executives, which allowed them to defer receipt of Long-term Incentivelong-term incentive cash compensation earned prior to 2009 when | | | | 2018 Proxy Statement • Compensation Discussion and Analysis | | 33 |
cash was a component of the Long-term Incentive Plan.LTIP. Executives were allowed to defer up to 100% of their earnedlong-term cash incentive into HMEC’s deferred Common Stock equivalent units. All the NEOs except Mr. HallmanConklin were hired after 2009 and do not have an account in the plan. Contributions and earnings reported below are for the year ended December 31, 2015 and the aggregate balance is as of December 31, 2015. The Company also sponsors an unfunded excess pension plan, the Nonqualified Defined Contribution Plan (“NQDCP”), which covers only the base salary compensation in excess of the Section 415 limit, which in 20152017 was $265,000.$270,000. The NQDCP accounts are established for the executives at the time their compensation exceeds the Section 415 limit and the NEOs are credited with an amount equal to 5% of the excess. In addition, the NQDCP accounts are credited with the same rate of return as the qualified plan sponsored by the Company for all employees. Clawbacks The Committee believes that our compensation program should reward performance that supports the Company’s culture of integrity through compliance with applicable laws and regulations and our codes of ethics and conduct. As a further step to support that belief, the Committee has determined that all Executive Officers are subject to the same standards as the CEO and CFO regarding cash compensation clawbacks as defined under Section 304 of the Sarbanes-Oxley Act of 2002. In addition, under the CECP, the Company is entitled to recover any cash or equity award if it is determined that an executive’s own misconduct contributed materially to the executive’s receipt of an award. If changes are made in future applicable legislative or regulatory guidance, the Company will modify the current clawback provisions to comply. Hedging, Pledging Prohibitions NEOs and other Executive Officers are prohibited from engaging in hedging transactions in our common stock. They are also prohibited from pledging their shares of our common stock. Perquisites and Personal Benefits The only perquisites we provide are financial planning services, which are commonly provided among our peer companies. Please see the “Summary Compensation Table” for further details. Our NEOs do not receive other personal benefits. Tax Implications Favorable tax treatment of the various elements of the Company’s total compensation program is an important, but not the sole, consideration in the design of the compensation program. On December 22, 2017, legislation commonly referred to as the Tax Cuts and Jobs Act (“Tax Act”) was enacted that significantly impacts the tax treatment of executive compensation. Section 162(m) of the Internal Revenue Code was revised and generally disallows a tax deduction to public corporations for compensation over $1,000,000 paid for any fiscal year to the corporation’s CEO, CFO, and three other most highly compensated Executive Officers (the Covered Employees). In addition, the Tax Act eliminates the exception for performance-based compensation subject to a transition rule forpre-existing contracts, provides that any individual identified as a Covered Employee beginning after December 31, 2016 remains a Covered Employee for all future years, and applies the $1,000,000 limitation to any compensation paid to such Covered Employees after employment ends or death. The Committee believes that Shareholder interests are best served by not restricting the Committee’s discretion and flexibility in developing compensation programs, even though such programs may result in certainnon-deductible compensation expenses as a result of the Tax Act. | | | | 34 | | 2018 Proxy Statement • Compensation Discussion and Analysis |
Compensation Tables Summary Compensation Table The following table sets forth information regarding compensation of the Company’s Chief Executive Officer, Chief Financial Officer, and the three other most highly compensated executive officers during 2017, 2016, and 2015. | | | | | | | | | | | | | | | | | | | | | | | | | | | | | | | | | Name & Principal
Position | | Year | | | Salary ($) (1) | | | Bonus ($) (2) | | | Stock Awards ($) (3) | | | Option Awards ($) (4) | | | Non-Equity
Incentive Plan
Compensation
($) (5) | | | All Other Compensation ($) | | | Total ($) | | Marita Zuraitis President & Chief Executive Officer | | | 2017 | | | | 841,667 | | | | 0 | | | | 1,085,000 | | | | 465,000 | | | | 803,455 | | | | 60,261 | | | | 3,255,383 | | | | | 2016 | | | | 800,000 | | | | 0 | | | | 2,580,000 | | | | 420,000 | | | | 898,240 | | | | 57,593 | | | | 4,755,833 | | | | | 2015 | | | | 742,333 | | | | 0 | | | | 770,000 | | | | 330,000 | | | | 749,809 | | | | 55,587 | | | | 2,647,729 | | Matthew P. Sharpe Executive Vice President, Life & Retirement | | | 2017 | | | | 412,500 | | | | 0 | | | | 395,500 | | | | 169,500 | | | | 236,264 | | | | 41,696 | | | | 1,255,460 | | | | | 2016 | | | | 400,000 | | | | 0 | | | | 950,000 | | | | 150,000 | | | | 269,472 | | | | 40,927 | | | | 1,810,399 | | | | | 2015 | | | | 394,000 | | | | 0 | | | | 350,000 | | | | 150,000 | | | | 265,312 | | | | 41,508 | | | | 1,200,820 | | | | | | | | | | | | | | | | | | | | | | | | | | | | | | | | | | | William J. Caldwell Executive Vice President, Property & Casualty | | | 2017 | | | | 370,833 | | | | 0 | | | | 252,000 | | | | 108,000 | | | | 212,398 | | | | 41,080 | | | | 984,311 | | | | | 2016 | | | | 335,417 | | | | 0 | | | | 770,000 | | | | 105,000 | | | | 196,490 | | | | 39,885 | | | | 1,446,792 | | | | | 2015 | | | | 325,000 | | | | 0 | | | | 210,000 | | | | 90,000 | | | | 164,136 | | | | 22,929 | | | | 812,065 | | | | | | | | | | | | | | | | | | | | | | | | | | | | | | | | | | | Bret A. Conklin Executive Vice President & Chief Financial Officer | | | 2017 | | | | 308,126 | | | | 0 | | | | 226,000 | | | | 54,000 | | | | 134,200 | | | | 18,079 | | | | 740,405 | | | | | 2016 | | | | 270,842 | | | | 0 | | | | 372,500 | | | | 52,500 | | | | 106,436 | | | | 17,201 | | | | 819,479 | | | | | 2015 | | | | 248,507 | | | | 0 | | | | 122,500 | | | | 52,500 | | | | 83,670 | | | | 19,360 | | | | 526,537 | | | | | | | | | | | | | | | | | | | | | | | | | | | | | | | | | | | Donald M. Carley Senior Vice President, General Counsel | | | 2017 | | | | 300,000 | | | | 0 | | | | 199,500 | | | | 85,500 | | | | 114,552 | | | | 22,725 | | | | 722,277 | | | | | 2016 | | | | 285,384 | | | | 150,000 | | | | 175,000 | | | | 75,000 | | | | 128,172 | | | | 22,094 | | | | 835,650 | | | | | 2015 | | | | n/a | | | | n/a | | | | n/a | | | | n/a | | | | n/a | | | | n/a | | | | n/a | | Dwayne D. Hallman Executive Vice President & Chief Financial Officer | | | 2017 | | | | 43,641 | | | | 0 | | | | 0 | | | | 0 | | | | 24,996 | | | | 18,631 | | | | 87,268 | | | | | 2016 | | | | 457,333 | | | | 0 | | | | 1,016,000 | | | | 150,000 | | | | 308,096 | | | | 22,225 | | | | 1,953,654 | | | | | 2015 | | | | 444,000 | | | | 0 | | | | 350,000 | | | | 150,000 | | | | 298,981 | | | | 28,000 | | | | 1,270,981 | | | | | | | | | | | | | | | | | | | | | | | | | | | | | | | | | | |
| (1) | Represents each NEO’s actual base salary earnings as of December 31, 2017, 2016 and 2015, respectively. Mr. Carley was hired in 2016 and Mr. Hallman passed away in February 2017. |
| (2) | For 2016 this represents asign-on bonus for Mr. Carley. |
| (3) | Represents the grant date fair value of service-based and performance-based RSUs granted in 2015, 2016, & 2017. Performance-based RSUs are valued based on the probable performance of Target with the potential of 50% to 200% being earned based on performance results. In 2016 it represents the grant date fair value of service-based and performance-based RSUs, and performance-based RSUs based on strategic initiatives. In 2017 it represents the grant date fair value of service-based and performance-based RSUs. |
| (4) | Represents the grant date fair value of $6.60 per share for stock options granted on March 7, 2017, the grant date fair value of $5.01 per share for stock options granted on March 9, 2016, and the grant date fair value of $11.15 per share for stock options granted on March 4, 2015. |
| (5) | Represents the cash payout for the AIP earned in each year. Mr. Conklin’s 2017 AIP is prorated based on his April 13, 2017 promotion to EVP and CFO. |
| | | | 2018 Proxy Statement • Compensation Discussion and Analysis | | 35 |
Detail of All Other Compensation The following table sets forth information regarding all other compensation paid to, or earned by, the NEOs in 2017. | | | | | | | | | | | | | | | | | | | | | | | Name & Principal Position | | Perquisites &
Other Personal
Benefits
($) (1) | | | Relocation | | | Company Contributions to Defined Contribution
Plans ($) | | | Total
($) | | | | | | | | Marita Zuraitis
President and Chief Executive
Officer | | | 15,140 | | | | 0 | | | | 45,121 | | | | 60,261 | | | | | | | | Matthew P. Sharpe
Executive Vice President, Life & Retirement | | | 15,140 | | | | 0 | | | | 26,556 | | | | 41,696 | | | | | | | | William J. Caldwell
Executive Vice President, Property & Casualty | | | 14,865 | | | | 0 | | | | 26,215 | | | | 41,080 | | | | | | | | Bret A. Conklin
Executive Vice President and Chief Financial Officer | | | 0 | | | | 0 | | | | 18,079 | | | | 18,079 | | | | | | | | Donald M. Carley
Senior Vice President, General Counsel | | | 0 | | | | 0 | | | | 22,725 | | | | 22,725 | | | | | | | | Dwayne D. Hallman
Executive Vice President and Chief Financial Officer | | | 15,140 | | | | 0 | | | | 3,491 | | | | 18,631 | |
| (1) | Includes the use of a financial planning service to help minimize distractions and help ensure appropriate focus on his or her Company responsibilities. |
CEO Pay Ratio Pursuant to Section 953(b) of the Dodd-Frank Wall Street Reform and Consumer Protection Act, we calculate a ratio of total pay for our Chief Executive Officer compared to total pay for our median employee (“CEO Pay Ratio”). To identify our median employee from among our employees as of 12/31/2017, we use total cash at target(annualized base salary as of 12/31/2017 plus annual bonus target), as we believe this is the most representative measure of annual compensation for our broader employee population. Once the median employee is identified, we compile the same pay elements for the median employee that we do for the NEOs as displayed in the Summary Compensation Table. We then compare total pay of our CEO (as displayed in the “Total $” column of the Summary Compensation Table) to total pay of our median employee. The following table sets forth information regarding CEO Pay Ratio. | | | | | | | | | | | | Total
Pay | | | Pay
Ratio | | Chief Executive Officer | | $ | 3,255,383 | | | | 51:1 | | Median Employee | | $ | 64,165 | | |
| | | | 36 | | 2018 Proxy Statement • Compensation Discussion and Analysis |
Grants of Plan Based Awards The following table sets forth information concerning the grant of the 2017 annual incentive and the grant of the 2017 long-term incentive for the 2017 – 2019 performance period. Actual payouts under the 2017 AIP are included in the “Summary Compensation Table.” Payouts for the 2017 long-term incentive grant and the determination of the actual RSUs earned will not occur until after the completion of the 2017 – 2019 performance period. | | | | | | | | | | | | | | | | | | | | | | | | | | | | | | | | | | | | | | | | | | | | | | | | | | | | | | Named Individual | | Grant
Date | | | | | | Estimated Future Payouts
UnderNon-Equity Incentive
Plan Awards (1) | | | | | | Estimated Future Payouts
Under Equity Incentive Plan
Awards (2) | | | All
Other
Stock
Awards:
Number
of
Shares
of
Stock
or Units
(#) (3) | | | All
Other
Option
Awards:
Number
of
Securities
Underlying
Options
(#) (4) | | | Exercise
or Base
Price
of
Option
Awards
($/Sh) | | | Grant
Date
Fair
Value
of
Stock
Option
Awards
($) (5) | | | | | Incentive
Plan | | | Threshold
($) | | | Target
($) | | | Maximum
($) | | | | | | Threshold
(#) | | | Target
(#) | | | Maximum
(#) | | | | | | Marita Zuraitis | | | | | | | AIP | | | | 420,834 | | | | 841,667 | | | | 1,683,334 | | | | | | | | N/A | | | | N/A | | | | N/A | | | | N/A | | | | N/A | | | | N/A | | | | N/A | | | | | 3/7/2017 | | | | LTI | | | | N/A | | | | N/A | | | | N/A | | | | | | | | 9,238 | | | | 18,475 | | | | 36,950 | | | | N/A | | | | N/A | | | | N/A | | | | N/A | | | | | 3/7/2017 | | | | LTI | | | | N/A | | | | N/A | | | | N/A | | | | | | | | N/A | | | | N/A | | | | N/A | | | | 7,392 | | | | N/A | | | | N/A | | | | N/A | | | | | 3/7/2017 | | | | LTI | | | | N/A | | | | N/A | | | | N/A | | | | | | | | N/A | | | | N/A | | | | N/A | | | | N/A | | | | 70,424 | | | $ | 41.95 | | | | 465,000 | | Matthew P. Sharpe | | | | | | | AIP | | | | 123,750 | | | | 247,500 | | | | 495,000 | | | | | | | | N/A | | | | N/A | | | | N/A | | | | N/A | | | | N/A | | | | N/A | | | | N/A | | | | | 3/7/2017 | | | | LTI | | | | N/A | | | | N/A | | | | N/A | | | | | | | | 3,368 | | | | 6,735 | | | | 13,470 | | | | N/A | | | | N/A | | | | N/A | | | | N/A | | | | | 3/7/2017 | | | | LTI | | | | N/A | | | | N/A | | | | N/A | | | | | | | | N/A | | | | N/A | | | | N/A | | | | 2,694 | | | | N/A | | | | N/A | | | | N/A | | | | | 3/7/2017 | | | | LTI | | | | N/A | | | | N/A | | | | N/A | | | | | | | | N/A | | | | N/A | | | | N/A | | | | N/A | | | | 25,672 | | | $ | 41.95 | | | | 169,500 | | William J. Caldwell | | | | | | | AIP | | | | 111,250 | | | | 222,500 | | | | 445,000 | | | | | | | | N/A | | | | N/A | | | | N/A | | | | N/A | | | | N/A | | | | N/A | | | | N/A | | | | | 3/7/2017 | | | | LTI | | | | N/A | | | | N/A | | | | N/A | | | | | | | | 2,146 | | | | 4,291 | | | | 8,582 | | | | N/A | | | | N/A | | | | N/A | | | | N/A | | | | | 3/7/2017 | | | | LTI | | | | N/A | | | | N/A | | | | N/A | | | | | | | | N/A | | | | N/A | | | | N/A | | | | 1,719 | | | | N/A | | | | N/A | | | | N/A | | | | | 3/7/2017 | | | | LTI | | | | N/A | | | | N/A | | | | N/A | | | | | | | | N/A | | | | N/A | | | | N/A | | | | N/A | | | | 16,360 | | | $ | 41.95 | | | | 108,000 | | Bret A. Conklin | | | | | | | AIP | | | | 70,292 | | | | 140,583 | | | | 281,166 | | | | | | | | N/A | | | | N/A | | | | N/A | | | | N/A | | | | N/A | | | | N/A | | | | N/A | | | | | 3/7/2017 | | | | LTI | | | | N/A | | | | N/A | | | | N/A | | | | | | | | 1,669 | | | | 3,338 | | | | 6,676 | | | | N/A | | | | N/A | | | | N/A | | | | N/A | | | | | 3/7/2017 | | | | LTI | | | | N/A | | | | N/A | | | | N/A | | | | | | | | N/A | | | | N/A | | | | N/A | | | | 2,055 | | | | N/A | | | | N/A | | | | N/A | | | | | 3/7/2017 | | | | LTI | | | | N/A | | | | N/A | | | | N/A | | | | | | | | N/A | | | | N/A | | | | N/A | | | | N/A | | | | 8,180 | | | $ | 41.95 | | | | 54,000 | | Donald M. Carley | | | | | | | AIP | | | | 60,000 | | | | 120,000 | | | | 240,000 | | | | | | | | N/A | | | | N/A | | | | N/A | | | | N/A | | | | N/A | | | | N/A | | | | N/A | | | | | 3/7/2017 | | | | LTI | | | | N/A | | | | N/A | | | | N/A | | | | | | | | 1,699 | | | | 3,397 | | | | 6,794 | | | | N/A | | | | N/A | | | | N/A | | | | N/A | | | | | 3/7/2017 | | | | LTI | | | | N/A | | | | N/A | | | | N/A | | | | | | | | N/A | | | | N/A | | | | N/A | | | | 1,359 | | | | N/A | | | | N/A | | | | N/A | | | | | 3/7/2017 | | | | LTI | | | | N/A | | | | N/A | | | | N/A | | | | | | | | N/A | | | | N/A | | | | N/A | | | | N/A | | | | 12,952 | | | $ | 41.95 | | | | 85,500 | | Dwayne D. Hallman | | | | | | | AIP | | | | 13,092 | | | | 26,184 | | | | 52,368 | | | | | | | | N/A | | | | N/A | | | | N/A | | | | N/A | | | | N/A | | | | N/A | | | | N/A | | | | | 3/7/2017 | | | | LTI | | | | N/A | | | | N/A | | | | N/A | | | | | | | | 0 | | | | 0 | | | | 0 | | | | N/A | | | | N/A | | | | N/A | | | | N/A | | | | | 3/7/2017 | | | | LTI | | | | N/A | | | | N/A | | | | N/A | | | | | | | | N/A | | | | N/A | | | | N/A | | | | 0 | | | | N/A | | | | N/A | | | | N/A | | | | | 3/7/2017 | | | | LTI | | | | N/A | | | | N/A | | | | N/A | | | | | | | | N/A | | | | N/A | | | | N/A | | | | N/A | | | | 0 | | | $ | 41.95 | | | | 0 | |
| (1) | Represents performance-based 2017 annual incentive. |
| (2) | Represents the performance-based portion of the 2017 long-term incentive grant, as well as a performance-based RSU grant based on strategic initiatives. |
| (3) | Represents the service-based RSU portion of the 2017 long-term incentive grant. |
| (4) | Represents the stock option portion of the 2017 long-term incentive grant. |
| (5) | Totals equate to each NEO’s 2017 long-term incentive amount. The fair value of stock options was determined using the Black-Scholes model. |
| | | | 2018 Proxy Statement • Compensation Discussion and Analysis | | 37 |
Outstanding Equity Awards at Fiscal Year End The following table sets forth information regarding the exercisable and unexercisable stock options, as well as the unvested RSUs held by each NEO at December 31, 2017. | | | | | | | | | | | | | | | | | | | | | | | | | | | | | | | | | | | | | | | | | | | | | | | | Option Awards | | | | | | Stock Awards (Restricted Stock Units) | | | Named Individual | | Number of
Securities
Underlying
Unexercised
Options
Exercisable
(#) | | | Number of
Securities
Underlying
Unexercised
Options
Unexercisable
(#) (1) | | | Equity
Incentive
Plan
Awards:
Number
of
Securities
Underlying
Unexercised
Unearned
Options
(#) | | | Option
Exercise
Price
($) | | | Grant
Date | | | Option
Expiration
Date | | | | | | Number of
Shares or
Units of
Stock
that Have
Not Vested
(#) (2) | | | Market
Value of
Shares or
Units of
Stock
that Have
Not Vested
($) (3) | | | Equity
Incentive
Plan
Awards:
Number of
Unearned
Shares,
Units, or
Other
Rights
that
Have
Not Vested
(#) (4) | | | Equity
Incentive
Plan
Awards:
Market or
Payout
Value of
Unearned
Shares,
Units, or
Other
Rights
that Have
Not Vested
($) (3) | | Marita Zuraitis | | | 9,248 | | | | 0 | | | | 0 | | | $ | 22.69 | | | | 05/22/13 | | | | 05/22/20 | | | | | | | | | | | | | | | | | | | | | | | | | | 24,972 | | | | 8,324 | | | | 0 | | | $ | 28.88 | | | | 03/05/14 | | | | 03/05/24 | | | | | | | | | | | | | | | | | | | | | | | | | | 14,798 | | | | 14,798 | | | | 0 | | | $ | 32.35 | | | | 03/04/15 | | | | 03/04/25 | | | | | | | | 24,435 | | | $ | 1,077,584 | | | | 115,999 | | | $ | 5,115,556 | | | | | | 20,979 | | | | 62,937 | | | | 0 | | | $ | 31.01 | | | | 03/09/16 | | | | 03/09/26 | | | | | | | | | | | | | | | | | | | | | | | | | | 0 | | | | 70,424 | | | | 0 | | | $ | 41.95 | | | | 03/07/17 | | | | 03/07/27 | | | | | | | | | | | | | | | | | | | | | | Matthew P. Sharpe | | | 7,893 | | | | 0 | | | | 0 | | | $ | 20.60 | | | | 03/05/13 | | | | 03/05/20 | | | | | | | | | | | | | | | | | | | | | | | | | | 9,990 | | | | 3,330 | | | | 0 | | | $ | 28.88 | | | | 03/05/14 | | | | 03/05/24 | | | | | | | | 9,411 | | | $ | 415,025 | | | | 44,348 | | | $ | 1,955,747 | | | | | | 6,726 | | | | 6,726 | | | | 0 | | | $ | 32.35 | | | | 03/04/15 | | | | 03/04/25 | | | | | | | | | | | | | | | | | | | | | | | | | | 7,493 | | | | 22,479 | | | | 0 | | | $ | 31.01 | | | | 03/09/16 | | | | 03/09/26 | | | | | | | | | | | | | | | | | | | | | | | | | | 0 | | | | 25,672 | | | | 0 | | | $ | 41.95 | | | | 03/07/17 | | | | 03/07/27 | | | | | | | | | | | | | | | | | | | | | | William J. Caldwell | | | 797 | | | | 0 | | | | 0 | | | $ | 30.24 | | | | 12/11/13 | | | | 12/11/20 | | | | | | | | | | | | | | | | | | | | | | | | | | 4,371 | | | | 1,457 | | | | 0 | | | $ | 28.88 | | | | 03/05/14 | | | | 03/05/24 | | | | | | | | | | | | | | | | | | | | | | | | | | 4,036 | | | | 4,036 | | | | 0 | | | $ | 32.35 | | | | 03/04/15 | | | | 03/04/25 | | | | | | | | 5,285 | | | $ | 233,069 | | | | 33,351 | | | $ | 1,470,779 | | | | | | 5,245 | | | | 15,735 | | | | 0 | | | $ | 31.01 | | | | 03/09/16 | | | | 03/09/26 | | | | | | | | | | | | | | | | | | | | | | | | | | 0 | | | | 16,360 | | | | 0 | | | $ | 41.95 | | | | 03/07/17 | | | | 03/07/27 | | | | | | | | | | | | | | | | | | | | | | Bret A. Conklin | | | 7,100 | | | | 0 | | | | 0 | | | $ | 17.01 | | | | 03/09/11 | | | | 03/09/18 | | | | | | | | | | | | | | | | | | | | | | | | | | 7,488 | | | | 0 | | | | 0 | | | $ | 17.32 | | | | 03/07/12 | | | | 03/07/19 | | | | | | | | | | | | | | | | | | | | | | | | | | 5,552 | | | | 0 | | | | 0 | | | $ | 20.60 | | | | 03/05/13 | | | | 03/05/20 | | | | | | | | | | | | | | | | | | | | | | | | | | 4,371 | | | | 1,457 | | | | 0 | | | $ | 28.88 | | | | 03/05/14 | | | | 03/05/24 | | | | | | | | 4,795 | | | $ | 211,460 | | | | 17,895 | | | $ | 789,170 | | | | | | 2,356 | | | | 2,356 | | | | 0 | | | $ | 32.35 | | | | 03/04/15 | | | | 03/04/25 | | | | | | | | | | | | | | | | | | | | | | | | | | 2,623 | | | | 7,869 | | | | 0 | | | $ | 31.01 | | | | 03/09/16 | | | | 03/09/26 | | | | | | | | | | | | | | | | | | | | | | | | | | 0 | | | | 8,180 | | | | 0 | | | $ | 41.95 | | | | 03/07/17 | | | | 03/07/27 | | | | | | | | | | | | | | | | | | | | | | Donald M. Carley | | | 3,747 | | | | 11,241 | | | | 0 | | | $ | 31.01 | | | | 03/09/16 | | | | 03/09/26 | | | | | | | | 2,531 | | | $ | 111,617 | | | | 7,756 | | | $ | 342,040 | | | | | | 0 | | | | 12,952 | | | | 0 | | | $ | 41.95 | | | | 03/07/17 | | | | 03/07/27 | | | | | | | | | | | | | | | | | | | | | | Dwayne D. Hallman | | | 0 | | | | 0 | | | | 0 | | | $ | 31.01 | | | | 03/09/16 | | | | 03/09/26 | | | | | | | | 0 | | | $ | 0 | | | | 0 | | | $ | 0 | |
| (1) | Long-term incentive stock option grants are service-based and all unexercisable options vest on each anniversary of the grant date at a rate of 25% of the original grant. |
| (2) | Represents the unvested service-based RSUs granted in 2013, 2014, 2015, 2016, and 2017. |
| (3) | Represents the value of the RSUs based on the closing stock price of $44.10 at December 31, 2017. |
| (4) | The performance-based RSUs granted in 2015 will not be earned until the end of the 2015-2017 performance period. RSUs earned at the end of the performance period will vest 100% in 2018. The performance-based RSUs granted in 2016 will not be earned until the end of the 2016-2018 performance period. RSUs earned at the end of the performance period will vest 100% in 2019. The performance-based RSUs granted in 2017 will not be earned until the end of the 2017-2019 performance period. RSUs earned at the end of the performance period will vest 100% in 2020. |
| | | | 38 | | 2018 Proxy Statement • Compensation Discussion and Analysis |
Option Exercises and Stock Vest The following table sets forth information regarding options exercised and stock awards acquired on vesting by the NEOs in 2017. | | | | | | | | | | | | | | | | | | | Named Individual | | Option Awards | | | | | Stock Awards | | | | Number of Shares
Acquired on
Exercise
(#) | | | Value Realized
on Exercise
($) | | | | | Number of
Shares
Acquired
on Vesting
(#) | | | Value
Realized on
Vesting ($) (1) | | | | | | | | | Marita Zuraitis | | | 17,628 | | | | 396,806 | | | | | | 27,854 | | | | 1,174,836 | | | | | | | | | Matthew P. Sharpe | | | 18,183 | | | | 478,770 | | | | | | 11,144 | | | | 470,121 | | | | | | | | | William J. Caldwell | | | 2,391 | | | | 36,367 | | | | | | 5,659 | | | | 239,255 | | | | | | | | | Bret A. Conklin | | | 0 | | | | 0 | | | | | | 5,910 | | | | 249,245 | | | | | | | | | Donald M. Carley | | | 0 | | | | 0 | | | | | | 0 | | | | 0 | | | | | | | | | Dwayne D. Hallman | | | 110,577 | | | | 1,448,929 | | | | | | 142,905 | | | | 6,003,916 | |
| (1) | The value realized on vesting of stock awards is determined by multiplying the number of shares vested by the closing stock price on the date of vesting. The actual amounts realized from vested stock awards will depend upon the sale price of the shares when they are actually sold. |
Nonqualified Defined Contribution and Other Nonqualified Deferred Compensation Plans The following table sets forth information regarding participation by the NEOs in the Company’s NQDCP and the nonqualified deferred compensation plan as of December 31, 2015.2017. | | | | | | | | | | | | | | | | | | | | | | | | Name | | Account | | Executive Contributions in Last FY ($) | | | Registrant Contributions in Last FY ($) (1) | | | Earnings in Last FY ($) (2) | | | Balance at Last FYE ($) | | | | | Marita Zuraitis | | NQDCP Account | | | 0 | | | | 23,867 | | | | 559 | | | | 34,936 | | | | | | | Deferred Compensation Account | | | 0 | | | | 0 | | | | 0 | | | | 0 | | | | | Dwayne D. Hallman | | NQDCP Account | | | 0 | | | | 8,950 | | | | 1,935 | | | | 49,666 | | | | | | | Deferred Compensation Account | | | 0 | | | | 0 | | | | 6,824 | | | | 237,649 | | | | | Matthew P. Sharpe | | NQDCP Account | | | 0 | | | | 6,450 | | | | 401 | | | | 14,879 | | | | | | | Deferred Compensation Account | | | 0 | | | | 0 | | | | 0 | | | | 0 | | | | | William J. Caldwell | | NQDCP Account | | | 0 | | | | 3,000 | | | | 0 | | | | 3,000 | | | | | | | Deferred Compensation Account | | | 0 | | | | 0 | | | | 0 | | | | 0 | | | | | Kelly J. Stacy | | NQDCP Account | | | 0 | | | | 0 | | | | 0 | | | | 0 | | | | | | | Deferred Compensation Account | | | 0 | | | | 0 | | | | 0 | | | | 0 | |
| | | | | | | | | | | | | | | | | | | Named Individual | | Account Name | | Executive
Contributions in
Last FY
($) | | | Registrant
Contributions in
Last FY
($) (1) | | | Aggregate
Earnings
in Last FY
($) (2) | | | Aggregate
Balance
at Last FYE
($) | | | | | | | | | | Marita Zuraitis | | NQDCP Account | | | 0 | | | | 28,583 | | | | 1,038 | | | | 92,034 | | | | | Deferred Compensation Account | | | 0 | | | | 0 | | | | 0 | | | | 0 | | | | | | | | | Matthew P. Sharpe | | NQDCP Account | | | 0 | | | | 7,125 | | | | 325 | | | | 29,317 | | | | | Deferred Compensation Account | | | 0 | | | | 0 | | | | 0 | | | | 0 | | | | | | | | | William J. Caldwell | | NQDCP Account | | | 0 | | | | 5,042 | | | | 119 | | | | 12,457 | | | | | Deferred Compensation Account | | | 0 | | | | 0 | | | | 0 | | | | 0 | | | | | | | | | Bret A. Conklin | | NQDCP Account | | | 0 | | | | 1,906 | | | | 121 | | | | 10,755 | | | | | Deferred Compensation Account | | | 0 | | | | 0 | | | | 22,249 | | | | 379,131 | | | | | | | | | Donald M. Carley | | NQDCP Account | | | 0 | | | | 1,500 | | | | 18 | | | | 2,537 | | | | | Deferred Compensation Account | | | 0 | | | | 0 | | | | 0 | | | | 0 | | | | | | | | | Dwayne D. Hallman | | NQDCP Account | | | 0 | | | | 0 | | | | 0 | | | | 0 | | | | | Deferred Compensation Account | | | 0 | | | | 0 | | | | 0 | | | | 0 | |
| (1) | Represents the 20152017 NQDCP registrant Company contributions. These contributions are included in the All Other Compensation column of the “Summary Compensation Table” for 2015. 2017. |
| (2) | Represents (a) the gains in the NQDCP in 20152017 and (b) the change in the deferred compensation account balance reflecting changes in the closing stock price of HMEC Common Stock from December 31, 20142016 to December 31, 2015,2017, each excluding contributions reflected in the first two columns. |
| | | 28 | | 2016 Proxy Statement • Compensation Discussion and Analysis |
Potential Payments upon Termination or Change in Control
The NEOs are entitled to receive certain payments on termination of employment in certain circumstances, including disability or death, involuntary termination other than for cause, or within a stated period after a change in control of the Company, as discussed in more detail below. An overview of benefits available under each scenario is provided below and should be read along with the footnotes accompanying the related table. These calculations are an estimate only for purposes of this Proxy Statement.
Termination for Cause or Voluntary Resignation
Generally, on a voluntary termination or a termination for cause, no amounts are paid other than salary earned through the date of termination, any annual incentive earned for the prior year that has not yet been paid, and other vested amounts (including equity) that are required to be paid or provided in those circumstances by law or under the Company’s plans and programs (“Minimum Benefit Obligations”). Unvested equity awards and unexercised options are generally forfeited, with some pro-rata vesting in the event of retirement. None of the NEOs was eligible for retirement as of December 31, 2015.
Disability or Death
Upon termination of employment for disability or death, NEOs do not receive payments other than the Minimum Benefit Obligations and a pro-rata annual incentive. Our equity plan gives the Committee discretion to address the treatment of equity awards on death or disability. Currently the award agreements provide as follows:
| • | | Stock Options – All stock options vest immediately. In the case of a termination for disability, executives have the full remaining option term to exercise the stock options. In the case of termination on account of death, the executive’s estate may exercise the stock options for the lesser of two years after death or over the remaining option term.
|
| • | | Service-based RSUs – All service-based RSUs vest immediately, including performance-based RSUs that have been earned but remain unvested at the termination date.
|
| • | | Performance-based RSUs – In the case of termination on account of disability, RSUs that remain subject to performance conditions will vest pro-rata at the end of the performance period, based on actual performance and the portion of the performance period the executive was employed. In the case of termination by death, RSUs that remain subject to performance conditions will vest pro-rata at target, based on the portion of the performance period the executive was employed.
|
Involuntary Termination other than for Cause and not under a Change in Control arrangement
The NEOs are covered under the Executive Severance Plan which provides the following benefits, in addition to the Minimum Benefit Obligations, in the event of an involuntary termination of employment initiated by the Company other than for cause, not due to disability or death, not under a Company mandatory retirement program, not covered by a change in control arrangement, and not where the executive is offered similar employment with an affiliate:
| • | | Pro-rata annual incentive for the fiscal year of termination, based on actual performance and the portion of the fiscal year employed prior to termination, payable at the same time as employees receive their annual incentive for that fiscal year.
|
| • | | Multiple of the sum of salary plus target annual incentive, payable in the form of salary continuation, based on the following table:
|
| | | Name | | Executive
Severance
Plan Multiple
| Marita Zuraitis | | 2.0 | Dwayne D. Hallman | | 1.5 | Matthew P. Sharpe | | 1.5 | William J. Caldwell | | 1.5 | Kelly J. Stacy | | 1.0 |
| • | | Continued applicable group health coverage under COBRA, if elected, at employee rates.
|
| • | | Our equity plan gives the Committee discretion to address the treatment of equity awards in the award agreements or at the time of termination. Currently the award agreements provide as follows with respect to involuntary termination of employment (not for cause) prior to or more than one year after a change in control:
|
| • | | Stock Options – Unexercised options terminate immediately, whether or not vested.
|
| • | | Service-based RSUs – All unvested service-based RSUs are forfeited, including performance-based RSUs that have been earned but remain unvested at the termination date.
|
| • | | Performance-based RSUs – All unvested RSUs that remain subject to performance conditions are forfeited.
|
These payments and benefits are subject to potential cutback to the extent they trigger a “golden parachute” excise tax unless the executive would be better off, net after tax, receiving the full amount and paying the tax.
| | | 20162018 Proxy Statement • Compensation Discussion and Analysis | | 2939 |
Payment of these severance amounts and provision of these benefits is subject to the executive’s entry into a customary waiver and release. The executives are also subject to restrictive covenants, including confidentiality, non-compete, non-solicitation, non-interference and non-disparagement provisions (“Restrictive Covenants”).
Qualifying termination after a Change in Control of the Company
The NEOs other than Mr. Hallman are covered under the Executive CIC Plan.
Under the Executive CIC Plan, benefits are provided in the event of an involuntary termination (other than for cause, disability or death) or a constructive discharge (a “good reason” termination, as defined in the Executive CIC Plan) within one year following a change in control of the Company (as defined in the Executive CIC Plan) - a so-called “double trigger” arrangement. In addition to the Minimum Benefit Obligations, the following payments and benefits are provided:
An amount equal to the target annual incentive for the fiscal year of termination, prorated for the time elapsed in the fiscal year prior to termination.
The multiple of the sum of salary plus target annual incentive indicated in the following table, payable in a lump sum:
| | | Name | | CIC
Multiple
| Marita Zuraitis | | 2.5 | Dwayne D. Hallman | | 2.0 | Matthew P. Sharpe | | 2.0 | William J. Caldwell | | 2.0 | Kelly J. Stacy | | 1.0
|
| • | | Continued applicable group health coverage under COBRA, if elected, at employee rates.
|
| • | | Our equity plan generally gives the Committee discretion to address treatment of equity in the applicable award agreements. Currently the award agreements provide for the following treatment in the event of a change in control:
|
| • | | Stock Options – If the acquiror assumes the options, then in the event of an involuntary termination (not for cause) within one year after the change in control, all stock options vest immediately, and executives have the full remaining option term to exercise the stock options. If the acquiror does not assume the options, they vest immediately upon the change in control, and the executives have the full remaining option term to exercise the options.
|
| • | | Service-based RSUs – All service-based RSUs vest immediately, including performance-based RSUs that have been earned but remain unvested at the termination date, if the grantee has an involuntary termination of employment (not for cause) within one year after the change in control.
|
| • | | Performance-based RSUs – All performance-based RSUs vest immediately if the grantee has an involuntary termination of employment (not for cause) within one year after the change in control.
|
There is no tax gross-up under the Executive CIC Plan. However, if the payments and benefits are such that the executive would become subject to the “golden parachute” tax, then, unless the executive would be better off, net after tax, receiving the entire amount of payments and benefits and paying the “golden parachute” tax (in which case the full amount will be paid or provided), the payments and benefits will be cut back to the highest level that does not trigger the “golden parachute” tax. There is no duplication of benefits with the Executive Severance Plan.
Each covered NEO is also subject to Restrictive Covenants and, as a condition of receiving payment, would be required to enter into a customary waiver and release of claims against the Company.
Mr. Hallman has an individual severance agreement under which he will become entitled to severance benefits only if he has an involuntary termination of employment by the Company (other than for cause) within three years following a change in control of the Company (as defined in the agreement). This is also a “double trigger” arrangement.
Under his individual severance agreement, Mr. Hallman would be entitled to the payments and benefits listed below in addition to the Minimum Benefit Obligations:
| • | | Two times the sum of his base salary plus his highest annual bonus in the 5 years preceding the year of his termination, payable in a lump sum, and
|
| • | | Two years continued coverage under disability, life, accident and health plans at employee rates.
|
Mr. Hallman would also be entitled to a tax gross-up if the amount of his payments and benefits is such that he becomes subject to the 20% “golden parachute” tax. The tax gross-up would be in an amount sufficient to leave Mr. Hallman in the same after-tax position as if he had not been subject to the 20% “golden parachute” tax.
Mr. Hallman would also be subject to Restrictive Covenants and would be required to enter into a customary waiver and release of claims against the Company. There is no duplication of benefits under the Executive Severance Plan.
| | | 30 | | 2016 Proxy Statement • Compensation Discussion and Analysis |
Illustration of Potential Payments upon Termination or Change in Control The following table presents the estimated payments and benefits that would have been payable as of the end of 20152017 in the event of separation due to disability or death, cause, voluntary termination of employment, retirement, involuntary termination of employment without cause, and a change of control of the Company. Consistent with SEC requirements, these estimated amounts have been calculated as if the NEOs’ employment had been terminated as of December 31, 2015, the last business day of 2015,2017, using the closing market price of our Common Stock on that dateDecember 29, 2017, the last business day of 2017 ($33.18)44.10). The amounts reported in the following table are hypothetical amounts based on the disclosure of compensation information about the NEOs. Actual payments will depend on the circumstances and timing of any termination of employment or other triggering event. | | | | | | | | | | | | | | | | | | | | | | | | | | Estimated Payments ($) Assuming Termination as of December 31, 2015 (1)(2) | | | | | Name & Benefits | | Disability or Death | | | For Cause | | | Voluntary | | | Involuntary
Termination w/o Cause | | | Change in
Control | | | | | Marita Zuraitis | | | | | | | | | | | | | | | | | | | | | | | | Cash Severance | | | 0 | | | | 0 | | | | 0 | | | | 2,850,000 | | | | 3,562,500 | | | | | AIP | | | 675,000 | | | | 0 | | | | 0 | | | | 675,000 | | | | 675,000 | | | | | Acceleration of Stock Options | | | 272,909 | | | | 0 | | | | 0 | | | | 0 | | | | 272,909 | | | | | Acceleration of RSUs | | | 2,654,102 | | | | 0 | | | | 0 | | | | 0 | | | | 3,221,679 | | | | | Health and Welfare | | | 0 | | | | 0 | | | | 0 | | | | 38,019 | | | | 38,019 | | | | | Modified Cap Adjustment (3) | | | N/A | | | | N/A | | | | N/A | | | | N/A | | | | N/A | | | | | TOTAL | | | 3,602,011 | | | | 0 | | | | 0 | | | | 3,563,019 | | | | 7,770,107 | | | | | Dwayne D. Hallman (4) | | | | | | | | | | | | | | | | | | | | | | | | Cash Severance | | | 0 | | | | 0 | | | | 0 | | | | 1,065,600 | | | | 1,546,550 | | | | | AIP | | | 266,400 | | | | 0 | | | | 0 | | | | 266,400 | | | | 266,400 | | | | | Acceleration of Stock Options | | | 316,943 | | | | 0 | | | | 0 | | | | 0 | | | | 316,943 | | | | | Acceleration of RSUs | | | 816,029 | | | | 0 | | | | 0 | | | | 0 | | | | 1,082,763 | | | | | Health and Welfare | | | 0 | | | | 0 | | | | 0 | | | | 31,416 | | | | 52,607 | | | | | Tax Gross-Up | | | N/A | | | | N/A | | | | N/A | | | | N/A | | | | 1,038,443 | | | | | TOTAL | | | 1,399,372 | | | | 0 | | | | 0 | | | | 1,363,416 | | | | 4,303,706 | | | | | Matthew P. Sharpe | | | | | | | | | | | | | | | | | | | | | | | | Cash Severance | | | 0 | | | | 0 | | | | 0 | | | | 960,000 | | | | 1,280,000 | | | | | AIP | | | 240,000 | | | | 0 | | | | 0 | | | | 240,000 | | | | 240,000 | | | | | Acceleration of Stock Options | | | 183,321 | | | | 0 | | | | 0 | | | | 0 | | | | 183,321 | | | | | Acceleration of RSUs | | | 606,575 | | | | 0 | | | | 0 | | | | 0 | | | | 854,120 | | | | | Health and Welfare | | | 0 | | | | 0 | | | | 0 | | | | 38,019 | | | | 38,019 | | | | | Modified Cap Adjustment (3) | | | N/A | | | | N/A | | | | N/A | | | | N/A | | | | N/A | | | | | TOTAL | | | 1,029,896 | | | | 0 | | | | 0 | | | | 1,238,019 | | | | 2,595,460 | | | | | William J. Caldwell | | | | | | | | | | | | | | | | | | | | | | | | Cash Severance | | | 0 | | | | 0 | | | | 0 | | | | 761,250 | | | | 1,015,000 | | | | | AIP | | | 157,500 | | | | 0 | | | | 0 | | | | 157,500 | | | | 157,500 | | | | | Acceleration of Stock Options | | | 30,181 | | | | 0 | | | | 0 | | | | 0 | | | | 30,181 | | | | | Acceleration of RSUs | | | 302,790 | | | | 0 | | | | 0 | | | | 0 | | | | 438,861 | | | | | Health and Welfare | | | 0 | | | | 0 | | | | 0 | | | | 10,887 | | | | 10,887 | | | | | Modified Cap Adjustment (3) | | | N/A | | | | N/A | | | | N/A | | | | N/A | | | | (361,562 | ) | | | | TOTAL | | | 490,471 | | | | 0 | | | | 0 | | | | 929,637 | | | | 1,290,867 | | | | | Kelly J. Stacy | | | | | | | | | | | | | | | | | | | | | | | | Cash Severance | | | 0 | | | | 0 | | | | 0 | | | | 420,000 | | | | 630,000 | | | | | AIP | | | 120,000 | | | | 0 | | | | 0 | | | | 120,000 | | | | 120,000 | | | | | Acceleration of Stock Options | | | 0 | | | | 0 | | | | 0 | | | | 0 | | | | 0 | | | | | Acceleration of RSUs | | | 208,624 | | | | 0 | | | | 0 | | | | 0 | | | | 307,943 | | | | | Health and Welfare | | | 0 | | | | 0 | | | | 0 | | | | 17,408 | | | | 17,408 | | | | | Modified Cap Adjustment (3) | | | N/A | | | | N/A | | | | N/A | | | | N/A | | | | N/A | | | | | TOTAL | | | 328,624 | | | | 0 | | | | 0 | | | | 557,408 | | | | 1,075,351 | |
| | | | | | | | | | | | | | | | | | | | | Estimated Payments ($) Assuming Termination as of December 31, 2017 (1)(2) | | Name & Benefits | | Disability or Death | | | For Cause | | | Voluntary | | | Involuntary
Termination w/o Cause | | | Change in
Control | | Marita Zuraitis | | | | | | | | | | | | | | | | | | | | | Cash Severance | | | 0 | | | | 0 | | | | 0 | | | | 3,400,000 | | | | 4,250,000 | | AIP | | | 850,000 | | | | 0 | | | | 0 | | | | 850,000 | | | | 850,000 | | Acceleration of Stock Options | | | 1,275,825 | | | | 0 | | | | 0 | | | | 0 | | | | 1,275,825 | | Acceleration of RSUs | | | 4,200,031 | | | | 0 | | | | 0 | | | | 0 | | | | 5,834,254 | | Health and Welfare | | | 0 | | | | 0 | | | | 0 | | | | 38,019 | | | | 38,019 | | Modified Cap Adjustment (3) | | | N/A | | | | N/A | | | | N/A | | | | N/A | | | | N/A | | TOTAL | | | 6,325,856 | | | | 0 | | | | 0 | | | | 4,288,019 | | | | 12,248,098 | | Bret A. Conklin | | | | | | | | | | | | | | | | | | | | | Cash Severance | | | 0 | | | | 0 | | | | 0 | | | | 720,000 | | | | 960,000 | | AIP | | | 160,000 | | | | 0 | | | | 0 | | | | 160,000 | | | | 160,000 | | Acceleration of Stock Options | | | 170,451 | | | | 0 | | | | 0 | | | | 0 | | | | 170,451 | | Acceleration of RSUs | | | 685,076 | | | | 0 | | | | 0 | | | | 0 | | | | 943,343 | | Health and Welfare | | | 0 | | | | 0 | | | | 0 | | | | 36,000 | | | | 36,000 | | TaxGross-Up | | | N/A | | | | N/A | | | | N/A | | | | N/A | | | | N/A | | TOTAL | | | 1,015,527 | | | | 0 | | | | 0 | | | | 916,000 | | | | 2,269,794 | | Matthew P. Sharpe | | | | | | | | | | | | | | | | | | | | | Cash Severance | | | 0 | | | | 0 | | | | 0 | | | | 996,000 | | | | 1,328,000 | | AIP | | | 249,000 | | | | 0 | | | | 0 | | | | 249,000 | | | | 249,000 | | Acceleration of Stock Options | | | 479,158 | | | | 0 | | | | 0 | | | | 0 | | | | 479,158 | | Acceleration of RSUs | | | 1,628,826 | | | | 0 | | | | 0 | | | | 0 | | | | 2,230,048 | | Health and Welfare | | | 0 | | | | 0 | | | | 0 | | | | 38,019 | | | | 38,019 | | Modified Cap Adjustment (3) | | | N/A | | | | N/A | | | | N/A | | | | N/A | | | | N/A | | TOTAL | | | 2,356,984 | | | | 0 | | | | 0 | | | | 1,283,019 | | | | 4,324,225 | | William J. Caldwell | | | | | | | | | | | | | | | | | | | | | Cash Severance | | | 0 | | | | 0 | | | | 0 | | | | 900,000 | | | | 1,200,000 | | AIP | | | 225,000 | | | | 0 | | | | 0 | | | | 225,000 | | | | 225,000 | | Acceleration of Stock Options | | | 310,744 | | | | 0 | | | | 0 | | | | 0 | | | | 310,744 | | Acceleration of RSUs | | | 1,148,559 | | | | 0 | | | | 0 | | | | 0 | | | | 1,606,739 | | Health and Welfare | | | 0 | | | | 0 | | | | 0 | | | | 10,887 | | | | 10,887 | | Modified Cap Adjustment (3) | | | N/A | | | | N/A | | | | N/A | | | | N/A | | | | N/A | | TOTAL | | | 1,684,303 | | | | 0 | | | | 0 | | | | 1,135,887 | | | | 3,353,370 | | Donald M. Carley | | | | | | | | | | | | | | | | | | | | | Cash Severance | | | 0 | | | | 0 | | | | 0 | | | | 420,000 | | | | 420,000 | | AIP | | | 120,000 | | | | 0 | | | | 0 | | | | 120,000 | | | | 120,000 | | Acceleration of Stock Options | | | 174,991 | | | | 0 | | | | 0 | | | | 0 | | | | 174,991 | | Acceleration of RSUs | | | 275,694 | | | | 0 | | | | 0 | | | | 0 | | | | 434,959 | | Health and Welfare | | | 0 | | | | 0 | | | | 0 | | | | 24,000 | | | | 24,000 | | Modified Cap Adjustment (3) | | | N/A | | | | N/A | | | | N/A | | | | N/A | | | | N/A | | TOTAL | | | 570,685 | | | | 0 | | | | 0 | | | | 564,000 | | | | 1,173,950 | |
N/A – Not applicable | | (1) | All AIP and LTI earned payouts are assumed to be at target. |
| | (2) | None of the NEOs were retirement eligible at December 31, 2015. 2017. |
| | (3) | Benefit reduction to avoid the imposition of a “golden parachute” tax. |
| (4) | Mr. Hallman is entitled to change in control benefits if his involuntary termination (without cause) is up to 3 years after the Change in Control.
|
| | | 201640 | | 2018 Proxy Statement • Compensation Discussion and Analysis | | 31 |
Compensation Committee Report The Compensation Committee has reviewed and discussed the Compensation Discussion and Analysis contained in this Proxy Statement with management. Based on our review of, and the discussions with management with respect to, the Compensation Discussion and Analysis, wethe Compensation Committee recommended to the Board of Directors that the Compensation Discussion and Analysis be included in this Proxy Statement. COMPENSATION COMMITTEE STEPHEN J. HASENMILLER,Chairman MARY H. FUTRELL, BEVERLEY J. MCCLURE and GABRIEL L. SHAHEEN,Members
Equity Compensation Plan Information The following table provides information as of December 31, 20152017 regarding outstanding awards and shares remaining available for future issuance under the Company’s equity compensation plans (excluding the 401(k) plan): | | | | | | | | | | | | | | | | | | Equity Compensation Plans | | Securities to be
Issued Upon the
Exercise of
Outstanding
Options,
Warrants and
Rights | | | Weighted Average
Exercise Price of
Outstanding Options,
Warrants and Rights | | | Securities Available for
Future Issuance Under Equity
Compensation Plans (4) | | | | | Plans Approved by Shareholders | | | | | | | | | | | | | | | | Stock Incentive Plans (1) | | | | | | | | | | | | | | | | Stock Options | | | 669,693 | | | $ | 24.00 | | | | N/A | | | | | Restricted Stock Units (2) | | | 1,442,325 | | | | N/A | | | | N/A | | | | | Subtotal | | | 2,112,018 | | | | N/A | | | | N/A | | | | | Deferred Compensation (2)(3) | | | 140,643 | | | | N/A | | | | N/A | | | | | Subtotal | | | 2,252,661 | | | | N/A | | | | 3,923,760 | | | | | Plans Not Approved by Shareholders | | | N/A | | | | N/A | | | | N/A | | | | | Total | | | 2,252,661 | | | | N/A | | | | 3,923,760 | |
| | | | | | | | | | | | | | | | | | Equity Compensation Plans | | Securities to be
Issued Upon the
Exercise of
Outstanding
Options,
Warrants and
Rights | | | Weighted Average
Exercise Price of
Outstanding Options,
Warrants and Rights | | | Securities Available for
Future Issuance Under Equity
Compensation Plans (4) | | | | | Plans Approved by Shareholders | | | | | | | | | | | | | | | | Stock Incentive Plans (1) | | | | | | | | | | | | | | | | Stock Options | | | 719,015 | | | $ | 32.80 | | | | N/A | | | | | Restricted Stock Units (2) | | | 1,149,679 | | | | N/A | | | | N/A | | | | | Subtotal | | | 1,868,694 | | | | N/A | | | | N/A | | | | | Deferred Compensation (2)(3) | | | 86,580 | | | | N/A | | | | N/A | | | | | Subtotal | | | 1,955,274 | | | | N/A | | | | 2,391,356 | | | | | Plans Not Approved by Shareholders | | | N/A | | | | N/A | | | | N/A | | | | | Total | | | 1,955,274 | | | | N/A | | | | 2,391,356 | |
N/A – Not applicable | | (1) | Includes grants under the HMEC 2010 Comprehensive Executive Compensation Plan, as amended, (“CECP”). CECP. |
| | (2) | No exercise price is associated with the shares of Common Stock issuable under these rights. |
| | (3) | The CECP permits Directors and participants in certain cash incentive programs to defer compensation in the form of Common Stock equivalent units,deferred cash RSUs, which can be settled in cash at the end of the specified deferral period. For purposes of the CECP, Common Stock equivalent unitsdeferred cash RSUs are valued at 100% of the fair market value of Common Stock on the date of crediting to the participant’s deferral account. There are 4340 senior executives of the Company currently eligible to participate in the CECP. The CECP does not reserve a specific number of shares for delivery in settlement of Common Stock equivalent unitsdeferred cash RSUs but instead provides that shares will be available to the extent needed for such settlements. Further information on the CECP appears in the “Compensation Discussion and Analysis”. |
| | (4) | Excludes securities reflected in the Securities to be Issued column and represents shares remaining as part of a fungible share pool. The pool of shares is reduced by 2.5 shares for every “full-value” Awardaward that is granted. |
| | | 322018 Proxy Statement • Compensation Discussion and Analysis | | 2016 Proxy Statement • Proposals and Company Information41 |
Executive Officers The following is certainprovides biographical information, as of March 15, 2016,2018, with respect to the executive officersExecutive Officers of the Company and its subsidiaries who are not Directors of the Company (together with Marita(Marita Zuraitis, President and Chief Executive Officer, whois a Director and is discussed above under “Board Nominees”, the “Executive Officers”):. Dwayne D. Hallman, 53Bret A. Conklin, 54
Executive Vice President and Chief Financial Officer Mr. Hallman was appointed to his present position as Executive Vice President and Chief Financial Officer in October 2010. He joined the Company in January 2003 as Senior Vice President, Finance. From September 2000 to December 2002, he served as the Chief Financial Officer of Acceptance Insurance Companies, where he was responsible for financial reporting, investor relations, the treasury and investment management functions and property-casualty operations. From July 1995 to August 2000, Mr. Hallman served as Vice President, Finance and Treasurer at Highlands Insurance Group, where he was responsible for financial reporting, treasury, planning and office services. He served as Vice President and Controller of Ranger Insurance Company from 1988 to 1995. From 1984 to 1988, Mr. Hallman was associated with KPMG Peat Marwick, specializing in its insurance industry practice. Mr. Hallman has over 30 years of experience in the insurance industry. Matthew P. Sharpe, 54
Executive Vice President, Annuity and Life
Mr. Sharpe joined the Company in January 2012 as Executive Vice President, Annuity and Life. Mr. Sharpe was previously with Genworth Financial, Inc. from 1999 to 2011 where he most recently served as Senior Vice President. During his tenure at Genworth, he gained an extensive annuity and life background while leading a variety of successful growth, product development, strategic, marketing and sales initiatives. Mr. Sharpe has over 25 years of experience in the insurance industry.
William J. Caldwell, 45
Executive Vice President, Property & Casualty
Mr. CaldwellConklin was appointed to his present position of Executive Vice President Property and CasualtyChief Financial Officer in July 2015.April 2017. He joined the Company in November 2013 as Senior Vice President, Personal Lines, and was appointed Senior Vice President, Property & Casualty in October 2014. Mr. Caldwell previously served as Head of Property Products at QBE North America from June 2011 through November 2013, Senior Vice President of Bank of America from August 2007 to June 2011 and Vice President of Unitrin from June 2001 to August 2007. Mr. Caldwell has over 20 years of experience in the insurance industry.
Kelly J. Stacy, 57
Senior Vice President, Field Operations and Distribution
Mr. Stacy joined the Company in July 2015 as Senior Vice President, Field Operations and Distribution. Mr. Stacy previously served as Northeast Regional President with The Hanover Insurance Group, a position he held since 2011. He served as Regional President and led Travelers Select commercial field operations from 2007 to 2011 and he served as Senior Vice President of marketing and field operations at the Main Street America Group from 1998 to 2007. Mr. Stacy has more than 30 years of property and casualty industry experience leading field operations, distribution and sales.
Bret A. Conklin, 52
Senior Vice President and Controller
Mr. Conklin joined the Company as Senior Vice President and Controller in January 2002. Mr. Conklin previously served as Vice President of Kemper Insurance from January 2000 through January 2002, where he was responsible for all corporate financial reporting and accounting operations; Vice President and Controller of the Company from July 1998 through January 2000; and Vice President and Controller of Pekin Insurance from September 1992 through June 1998. He has seven years of public accounting experience with KPMG Peat Marwick from 1985 to 1992, specializing in its insurance industry practice. Mr. Conklin has over 30 years of experience in the insurance industry.
Bret L. Benham, 57 Executive Vice President, Life & Retirement Mr. Benham joined the Company in November 2017 as Executive Vice President, Life & Retirement. Prior to that, he served as Senior Vice President of Retirement at Ameritas, a position he held since 2013, and also held executive positions at TIAA-CREF and Fidelity Investments. Mr. Benham has served on multiple industry boards, including the American Council of Life Insurers (ACLI), Insurance Information Institute and Retirement Income Industry Association. He has a proven track record of delivering profitable growth, driving operational excellence, and has an innovative approach to products and distribution. Mr. Benham has over 35 years of experience in the insurance and financial services industry. William J. Caldwell, 47 Executive Vice President, Property & Casualty Mr. Caldwell was appointed to his present position of Executive Vice President, Property and Casualty in July 2015. He joined the Company in November 2013 as Senior Vice President, Personal Lines, and was appointed Senior Vice President, Property & Casualty in October 2014. Mr. Caldwell previously served as Head of Property Products at QBE North America from June 2011 through November 2013, Senior Vice President of Bank of America from August 2007 to June 2011 and Vice President of Unitrin from June 2001 to August 2007. Mr. Caldwell has over 25 years of experience in the insurance industry. Allan C. Robinson, 56 Executive Vice President, Field Operations & Sales Management Mr. Robinson was appointed to his present position of Executive Vice President in March 2018 and assumed responsibility for Field Operations and Sales Management in May 2017. He joined the Company in 2015 as Senior Vice President of Claims. Prior to joining the Company, Mr. Robinson served as Vice President of Claims at Hanover Insurance Group, an insurance provider, since 2010, and spent 27 years at the Allstate Corporation holding a variety of roles in their claims organization including Vice President. Mr. Robinson has more than 30 years of experience in the insurance industry. Matthew P. Sharpe, 56 Executive Vice President, Strategy & Business Development Mr. Sharpe was appointed to his present position as Executive Vice President, Strategy and Business Development in November 2017. He took on that role after modernizing our Life & Retirement suite and infrastructure as Executive Vice President, Life & Retirement, a position he held since joining the Company in January 2012. Prior to joining the Company, Mr. Sharpe was with Genworth Financial, Inc. from 1999 to 2011 where he most recently served as Senior Vice President. During his tenure at Genworth, he gained an extensive annuity and life background while leading a variety of successful growth, product development, strategic, marketing and | | | | 42 | | 2018 Proxy Statement • Compensation Discussion and Analysis |
sales initiatives. He is a member of the Board of Directors of the Illinois Life Insurance Council and Central Illinois Foodbank. Mr. Sharpe has over 30 years of experience in the insurance and financial services industry. Donald M. Carley, 50 Senior Vice President, General Counsel, Corporate Secretary and Chief Compliance Officer Mr. Carley joined the Company in January 2016 as General Counsel. He assumed the additional responsibilities of Corporate Secretary and Chief Compliance Officer in May 2016 and was appointed Senior Vice President in November 2016. Mr. Carley previously served as Associate General Counsel at State Farm Mutual Automobile Insurance Company, an insurance provider, since 2008. Prior to that, he spent 10 years in private practice at Sonnenschein Nath & Rosenthal LLP (now known as Dentons), most recently as partner of the firm. Mr. Carley has more than 25 years of private practice and corporate experience with a focus on insurance industry litigation, legislative, regulatory, claims and operational issues. Sandra L. Figurski, 5254 Senior Vice President and Chief Information Officer Ms. Figurski was appointed to her present position as Senior Vice President and Chief Information Officer in November 2014. She joined the Company in September 2013 as Chief Technology Officer. Ms. Figurski was previously with Allstate Insurance Company, an insurance provider, from 1981 to 2013 where she most recently served as Vice President and Divisional Chief Information Officer. Ms. Figurski has over 3035 years of experience in the insurance industry. John P. McCarthy, 6062 Senior Vice President and Chief Human Resources Officer Mr. McCarthy joined the Company in May 2014 as Senior Vice President and Chief Human Resources Officer. Mr. McCarthy’s previous experience includes Guardian Life Insurance Company, a life insurance provider, where he worked from December 2008 through March 2014, joining the companyCompany as Executive Vice President, Human Resources where he helped build a high-performing organization focusing on talent, leadership and culture. He was with Wachovia Corporation from December 1998 to December 2008, where he held multiple positions including Senior Managing Director. He is currently Chair-Elect of the Board of Directors of The Greater Springfield Chamber of Commerce. Mr. McCarthy has over 30 years of experience in the insurance and financial services industry. Kimberly A. Johnson, 51 Vice President and insurance industries. Ann M. Caparrós, 63
Chief Compliance Officer and Corporate SecretaryController
Ms. CaparrósJohnson was appointed to her present position as Vice President and Controller in April of 2017. She joined the Company in March 19942002 as Vice President, General Counsel and Corporate Secretary and the additional responsibilities of Chief Compliance Officer were formalized in 2000.Assistant Controller. Prior to March 1994,that, she was associated with John DeereMSI Insurance Group from 19891991 to 1994 as2002 where she held multiple positions, including Vice President and General Counsel. She also was staff counsel for the Kellogg Company from 1988 to 1989 and United of Omaha Life Insurance Company from 1978 to 1988.Controller. Ms. CaparrósJohnson has over 3525 years of experience in the insurance industry. Donald M. Carley, 48
General Counsel
Mr. Carley joined the company in January 2016 as General Counsel. He previously served as Associate General Counsel at State Farm Mutual Automobile Insurance Company, a position he held since 2008. Prior to that, he spent 10 years in private practice at Sonnenschein, Nath & Rosenthal (now known as Dentons), most recently as partner of the firm. Mr. Carley has more than 25 years of private practice and corporate experience with a focus on insurance industry litigation, legislative, regulatory, claims and operational issues.
| | | 20162018 Proxy Statement • Proposals Compensation Discussion and Company InformationAnalysis | | 3343 |
Security Ownership of Certain Beneficial Owners and Management The following table sets forth certain information regarding beneficial ownership of shares of Common Stock by each person who is known by the Company to own beneficially more than 5% of the issued and outstanding shares of Common Stock, and by each of the Company’s Directors, Board Nominees and the Company’s Chief Executive Officer, Chief Financial Officer and the other three highest compensated Executive Officers employed at the end of 2015 (collectively the “Named Executive Officers”),NEOs, and by all Directors and Executive Officers of the Company as a group. Information in the table is as of March 15, 2016,2018, except that the ownership information for the 5% beneficial owners is as of December 31, 20152017 based on information reported by such persons to the SEC. Except as otherwise indicated, to the Company’s knowledge all shares of Common Stock are beneficially owned, and investment and voting power is held solely by the persons named as owners. | | | | | | | | | | | | Common Stock Ownership | | Beneficial Ownership Amount | | Percent of Class | | | | | 5% Beneficial Owners | | | | | | | | | | BlackRock, Inc. (1) | | 3,841,578 | | | 9.4 | % | | | | Dimensional Fund Advisors LP (2) | | 3,512,479 | | | 8.6 | % | | | | Hotchkis and Wiley Capital Management, LLC (3) | | 3,073,086 | | | 7.6 | % | | | | The Vanguard Group, Inc (4) | | 3,042,326 | | | 7.5 | % | | | | Silvercrest Asset Management Group, LLC (5) | | 2,517,759 | | | 6.2 | % | | | | Directors, Board Nominees and Executive Officers | | | | | | | | | | Daniel A. Domenech (6) | | 2,023 | | | * | | | | | Mary H. Futrell (7) | | 72,375 | | | * | | | | | Stephen J. Hasenmiller | | 28,570 | | | * | | | | | Ronald J. Helow (8) | | 28,286 | | | * | | | | | Beverley J. McClure (9) | | 10,322 | | | * | | | | | H. Wade Reece | | 0 | | | 0.0 | % | | | | Gabriel L. Shaheen (10) | | 48,454 | | | * | | | | | Robert Stricker (11) | | 37,081 | | | * | | | | | Steven O. Swyers (12) | | 3,278 | | | * | | | | | Marita Zuraitis (13) | | 190,978 | | | * | | | | | Dwayne D. Hallman (14) | | 197,862 | | | * | | | | | Matthew P. Sharpe (15) | | 75,422 | | | * | | | | | William J. Caldwell (16) | | 11,750 | | | * | | | | | Kelly J. Stacy | | 633 | | | * | | | | | All Directors and Executive Officers as a group (18 persons) (17) | | 872,155 | | | 2.1 | % |
* | | | | | | | | | | | | | Common Stock Ownership | | Beneficial Ownership Amount | | Percent of Class | | | | | 5% Beneficial Owners | | | | | | | | | | BlackRock, Inc. (1) | | 5,348,030 | | | 13.2 | % | | | | The Vanguard Group, Inc. (2) | | 3,901,618 | | | 9.6 | % | | | | Dimensional Fund Advisors LP (3) | | 3,430,213 | | | 8.4 | % | | | | Silvercrest Asset Management Group, LLC (4) | | 2,141,689 | | | 5.3 | % | | | | Directors, Board Nominees and Executive Officers | | | | | | | | | | Daniel A. Domenech (5) | | 12,222 | | | * | | | | | Stephen J. Hasenmiller | | 34,108 | | | * | | | | | Ronald J. Helow (6) | | 35,661 | | | * | | | | | Perry G. Hines | | 0 | | | 0.0 | % | | | | Beverley J. McClure (7) | | 16,652 | | | * | | | | | H. Wade Reece (8) | | 2,974 | | | * | | | | | Gabriel L. Shaheen (9) | | 57,006 | | | * | | | | | Robert Stricker (10) | | 36,666 | | | * | | | | | Steven O. Swyers (11) | | 9,197 | | | * | | | | | Marita Zuraitis (12) | | 344,673 | | | * | | | | | Bret A. Conklin (13) | | 81,182 | | | * | | | | | Matthew P. Sharpe (14) | | 132,154 | | | * | | | | | William J. Caldwell (15) | | 46,348 | | | * | | | | | Donald M. Carley (16) | | 11,850 | | | * | | | | | All Directors and Executive Officers as a group (18 persons) (17) | | 929,106 | | | 2.2 | % |
* Less than 1% |
| (1) | BlackRock Inc. (“BlackRock”) has a principal place of business at 55 East 52nd Street, New York, New York 10055. BlackRock has sole voting power with respect to 3,745,2885,246,566 shares and sole investment power with respect to 3,841,5785,348,030 shares. The foregoing is based on Amendment No. 9 to Schedule 13G filed by BlackRock on January 19, 2018. |
| (2) | The Vanguard Group, Inc. (“Vanguard”) has a principal place of business at 100 Vanguard Boulevard, Malvern, Pennsylvania 19355. Vanguard has sole voting power with respect to 48,512 shares, sole investment power with respect to 3,854,478 shares, and shared investment power with respect to 47,140 shares. The foregoing is based on Amendment No. 6 to Schedule 13G filed by BlackRockVanguard on January 26, 2016.February 9, 2018. |
(2)(3) | Dimensional Fund Advisors LP (“Dimensional”) has a principal place of business at Building One, 6300 Bee Cave Road, Austin, Texas 78746. Dimensional has sole voting power with respect to 3,398,9823,311,490 shares and sole investment power with respect to 3,512,4793,430,213 shares. Dimensional disclaims beneficial ownership of such securities. The foregoing is based on Amendment No. 10 to Schedule 13G filed by Dimensional on February 9, 2016. 2018. |
(3) | Hotchkis and Wiley Capital Management, LLC (“Hotchkis and Wiley”) has a principal place of business at 725 South Figueroa Street, 39th Floor, Los Angeles, California 90017. Hotchkis and Wiley has sole voting power with respect to 2,547,386 shares and sole investment power with respect to 3,073,086 shares. Hotchkis and Wiley disclaims beneficial ownership of such securities. The foregoing is based on Amendment No. 1 to Schedule 13G filed by Hotchkis and Wiley on February 12, 2016.
|
| (4) | The Vanguard Group, Inc. (“Vanguard”) has a principal place of business at 100 Vanguard Boulevard, Malvern, Pennsylvania 19355. Vanguard has sole voting power with respect to 51,631 shares, sole investment power with respect to 2,989,895 shares, and shared investment power with respect to 52,431 shares. The foregoing is based on Amendment No. 4 to Schedule 13G filed by Vanguard on February 11, 2016.
|
(5) | Silvercrest Asset Management Group, LLC (“Silvercrest”) has a principal place of business at 1330 Avenue of the Americas, 38th Floor, New York, New York 10019. Silvercrest has shared voting and investment power with respect to 2,517,7592,141,689 shares. The foregoing is based on Amendment No. 24 to Schedule 13G filed by Silvercrest on February 16, 2016. 14, 2018. |
(6)(5) | Consists entirely of 2,023 CSUs pursuant to the CECP. |
(7) | Includes 34,885 CSUs6,494 deferred cash RSUs and 32,4795,728 vested share-based RSUs pursuant to the CECP.
|
(8)(6) | Consists entirely of 28,28635,661 vested share-based RSUs pursuant to the CECP. |
(9)(7) | Consists entirely of 3,223 CSUs3,411 deferred cash RSUs and 7,09913,241 vested share-based RSUs pursuant to the CECP. |
| (8) | Consists entirely of 2,974 vested share-based RSUs pursuant to the CECP. |
| (9) | Consists entirely of 15,030 deferred cash RSUs and 41,976 vested share-based RSUs pursuant to the CECP. |
| (10) | Consists entirely of 14,202 CSUsIncludes 10,169 deferred cash RSUs and 34,25215,977 vested share-based RSUs pursuant to the CECP.
|
| (11) | Includes 9,609 CSUs and 24,264Consists entirely of 9,197 vested share-based RSUs pursuant to the CECP.
|
| (12) | Consists entirely of 3,278Includes 124,305 vested stock options and 194,768 vested share-based RSUs pursuant to the CECP.
|
| (13) | Consists entirely of 37,485Includes 29,693 vested stock options, 9,102 deferred cash RSUs and 34,443 vested share-based RSUs pursuant to the CECP.
|
| (14) | Includes 52,706 vested stock options and 153,49360,908 vested share-based RSUs pursuant to the CECP. |
(14)(15) | Includes 76,04327,259 vested stock options 7,162 CSUs and 112,1618,826 vested share-based RSUs pursuant to the CECP. |
(15)(16) | Consists entirely of 33,32410,732 vested stock options and 42,0981,118 vested share-based RSUs pursuant to the CECP. |
(16)(17) | Includes 6,526303,619 vested stock options, 44,206 deferred cash RSUs and 2,934463,064 vested share-based RSUs pursuant to the CECP. |
(17) | Includes 202,301 vested stock options, 92,661 CSUs and 520,930 vested RSUs pursuant to the CECP.
|
| | | 3444 | | 20162018 Proxy Statement • Proposals Compensation Discussion and Company InformationAnalysis |
Section 16(a) Beneficial Ownership Reporting Compliance Section 16(a) of the Securities Exchange Act requires the Company’s Executive Officers and Directors and other persons who beneficially own more than ten percent of HMEC’s outstanding Common Stock, whom the Company refers to collectively as the “Reporting Persons”,Persons,” to file reports of ownership and changes in ownership with the SEC. The Company has established procedures by which Reporting Persons provide relevant information regarding transactions in Common Stock to a Company representative, and the Company prepares and files the required ownership reports. Based on a review of those reports and other written representations, the Company believes that all such reportsthere was full compliance with the reporting requirements under Section 16(a) with the following exceptions. Mr. Kelly Stacy, former Senior Vice President, Field Operations and Distribution, reported, but not on a timely basis, the sale of shares held directly on three occasions and the exercise and sale of stock options on two occasions in 2016 and one sale of shares held directly in 2017. All transactions were timely filed in 2015.reported on Form 4 on April 21, 2017 on which date Mr. Stacy ceased to be a Reporting Person. PROPOSAL NO. 3 - RATIFICATION OF INDEPENDENT REGISTERED PUBLIC ACCOUNTING FIRM The Audit Committee is directly responsible for the selection, compensation, retention, performance and evaluation of the Company’s independent registered public accounting firm. The Audit Committee considers the independence and evaluates the selection of the independent registered public accounting firm each year. KPMG LLP has been the Company’s independent registered public accounting firm for the past 2729 years (since the Company’s 1989 leveraged buyout). After careful consideration of a number of factors, including length of time the firm has served in this role, the firm’s past performance, and an assessment of the firm’s qualifications and resources, the Audit Committee selected KPMG LLP to serve as the independent registered public accounting firm for the year ending December 31, 2016.2018. As a matter of good corporate governance, the Audit Committee submits its selection of the auditors to the Shareholders for ratification. If the selection of KPMG LLP is not ratified, the Audit Committee will review its future selection of an independent registered public accounting firm in light of the vote result. Even if the selection is ratified, the Audit Committee in its discretion may select a different registered public accounting firm at any time during the year if it determines that such a change would be in the best interests of the Company and its Shareholders. A representative from KPMG LLP is expected to be present at the Annual Meeting. The representative will be given an opportunity to make a statement to Shareholders and is expected to be available to respond to appropriate questions from Shareholders. The Board recommends that Shareholders vote FOR the ratification of KPMG LLP, an independent registered public accounting firm, as the Company’s auditors for the year ending December 31, 2016.2018. | | | | 2018 Proxy Statement • Compensation Discussion and Analysis | | 45 |
Report of the Audit Committee Acting under a written charter, the Audit Committee oversees the Company’s financial reporting process on behalf of the Board of Directors. The Audit Committee is comprised of fourthree directors, each of whom is independent as defined by the New York Stock Exchange listing standards. Management has the primary responsibility for the Company’s financial statements and its reporting process, including the Company’s systems of internal controls. In fulfilling its oversight responsibilities, prior to the filing, the Audit Committee reviewed the audited consolidated financial statements in the Annual Report onand Form10-K with management including a discussion of the quality, not just the acceptability, of the accounting principles, the reasonableness of significant judgments, and clarity of disclosures in the financial statements. The Audit Committee has discussed with the Company’s independent registered public accounting firm, which is responsible for expressing an opinion on the conformity of those audited consolidated financial statements with United States generally accepted accounting principles, their judgments as to the quality, not just the acceptability, of the Company’s accounting principles and such other matters as are required by applicable requirements of the Public Company Accounting Oversight Board. In addition, the Audit Committee has received from the independent registered public accounting firm the written disclosures and the letter required by applicable requirements of the Public Company Accounting Oversight Board regarding the independent registered public accounting firm’s communications with the Audit Committee concerning independence, and discussed with them their independence from the Company and its management taking into account the potential effect of anynon-audit services provided by the independent registered public accounting firm. The Audit Committee discussed with the Company’s internal auditors and independent registered public accounting firm the overall scope and plans for their respective audits. The Audit Committee meets with the internal auditors and the independent registered public accounting firm, with and without management present, to discuss the results of their audits, their evaluations of the Company’s internal controls, and the overall quality of the Company’s financial reporting. The Audit Committee held twelve meetings during fiscal year 2015.2017. In reliance on the reviews and discussions referred to above, the Audit Committee recommended to the Board of Directors that the audited consolidated financial statements be included in the Annual Report onand Form10-K for the year ended December 31, 20152017 for filing with the Securities and Exchange Commission.SEC. The Audit Committee approved the selection of the Company’s independent registered public accounting firm. AUDIT COMMITTEE STEVEN O. SWYERS,Chairman RONALDSTEPHEN J. HELOW,HASENMILLER and BEVERLEY
J. MCCLURE, and ROBERT STRICKER,Members | | | 201646 | | 2018 Proxy Statement • Proposals Compensation Discussion and Company Information | | 35Analysis |
The Company’s Independent Registered Public Accounting Firm The independent registered public accounting firm selected by the Audit Committee to serve as the Company’s auditors for the year ending December 31, 20162018 is KPMG LLP. KPMG LLP served in that capacity for the year ended December 31, 2015.2017. Fees of KPMG LLP The following were the fees of KPMG LLP for the years ended December 31, 20152017 and 2014.2016. | | | | | | | | | | | | | | | | Fees | | 2015 | | | | | 2014 | | | | | Audit (1) | | | $ 2,188,900 | | | | | | $ 1,918,400 | | | | | Audit-Related (2) | | | $ 256,000 | | | | | | $ 226,300 | | | | | Tax (3) | | | 0 | | | | | | 0 | | | | | All Other (4) | | | 0 | | | | | | 0 | |
| | | | | | | | | | Fees | | 2017 | | | 2016 | | Audit (1) | | $ | 3,405,100 | | | $ | 2,229,300 | | Audit-Related (2) | | $ | 277,500 | | | $ | 256,400 | | Tax (3) | | | 0 | | | | 0 | | All Other (4) | | | 0 | | | | 0 | |
| | (1) | Represents the aggregate fees billed for professional services rendered by KPMG LLP for the audit of the Company’s annual financial statements for the years ended December 31, 20152017 and 2014,2016, the audit of the Company’s internal control over financial reporting as of December 31, 20152017 and 2014,2016, the reviews of the financial statements included in the Company’s quarterly reports on Forms10-Q for the years ended December 31, 20152017 and 20142016 and services in connection with the Company’s statutory and regulatory filings for the years ended December 31, 20152017 and 2014. Fees in 2015 included $148,500 related to the Company’s issuance of its 4.50% Senior Notes due 2025. 2016. |
| | (2) | Represents the aggregate fees billed for assurance and related services rendered by KPMG LLP that are reasonably related to the audit and review of the Company’s financial statements for the years ended December 31, 20152017 and 2014,2016, exclusive of the fees disclosed under “Audit Fees”. In 20152017 and 2014,2016, KPMG LLP audited the Company’s employee benefits plans. Also in 20152017 and 2014,2016, KPMG LLP prepared SOC1 reportsreported on the Company’s SOC1 reports over annuity operations. |
| | (3) | Represents the aggregate fees billed for tax compliance, consulting and planning services rendered by KPMG LLP during the years ended December 31, 20152017 and 2014. 2016. |
| | (4) | Represents the aggregate fees billed for all other services, exclusive of the fees disclosed above relating to audit, audit-related and tax services, rendered by KPMG LLP during the years ended December 31, 20152017 and 2014. 2016. |
Pre-Approval of Services Provided by the Independent Registered Public Accounting Firm The Audit Committee approves in advance any significant audit and allnon-audit engagements or services between the Company and the independent registered public accounting firm. As a practice, the Audit Committee does not allow “prohibitednon-auditing services” as defined by regulatory authorities to be performed by the same firm that audits the Company’s annual financial statements. The Audit Committee may delegate to one or more of its members the authority to approve in advance all significant audit and allnon-audit services to be provided by the independent registered public accounting firm so long as it is presented to the full Audit Committee at the next regularly scheduled meeting.Pre-approval is not necessary for de minimis audit services as long as such services are presented to the full Audit Committee at the next regularly scheduled meeting. The Audit Committee approved all of the above listed expenses. KPMG LLP did not provide anynon-audit related services during the years ended December 31, 20152017 and 2014. 2016. | | | 362018 Proxy Statement • Compensation Discussion and Analysis | | 2016 Proxy Statement • Proposals and Company Information47 |
Other Matters Delivery of Proxy Materials Electronic Access to Proxy Materials and Annual Report As we did last year, we are delivering a Notice of Internet Availability of Proxy Materials to Shareholders in lieu of a paper copy of the Proxy Statement and related materials and the Company’s Annual Report to Shareholders and Form10-K. If you received a Notice by mail, you will not receive a paper copy of the Proxy Materials unless you request one. Instead, the Notice will instruct you as to how you may access and review the Proxy Materials and cast your vote. If you received a Notice by mail and would like to receive a paper copy of our Proxy Materials, please follow the instructions included in the Notice. Shareholders also can elect to receive an email message that will provide a link to the Proxy Materials on the Internet. By opting to access your Proxy Materials via email, you will save the Company the cost of producing and mailing documents to you, reduce the amount of mail you receive and help preserve environmental resources. Shareholders who have enrolled previously in the electronic access service will receive their Proxy Materials via email this year. If you received a Notice by mail and would like to receive your Proxy Materials via email, please follow the instructions included in the Notice. Copies of Annual Report onand Form10-K | | | | | | | The Company will furnish, without charge, a copy of its most recent Annual Report onand Form10-K filed with the SEC to each person solicited hereunder who mails a written request to Investor Relations, Horace Mann Educators Corporation, 1 Horace Mann Plaza,C-120, Springfield, Illinois, 62715-0001. | | |
The Company also will furnish, upon request, a copy of all exhibits to the Annual Report onand Form10-K. In addition, the Company’s Annual Report onand Form10-K, Quarterly Reports on Form10-Q, Current Reports on Form8-K, Proxy Statements and all amendments to those reports are available free of charge through the Company’s Internet website, www.horacemann.com, as soon as reasonably practicable after such reports are electronically filed with, or furnished to, the SEC. The EDGAR filings of such reports are also available at the SEC’s website, www.sec.gov. Eliminating Duplicative Proxy Materials If you are a beneficial owner, your bank or broker may deliver a single Proxy Statement and Annual Report, along with individual proxy cards, or individual Notices to any household at which two or more shareholdersShareholders reside unless contrary instructions have been received from you. This procedure, referred to as householding, reduces the volume of duplicate materials shareholdersShareholders receive and reduces mailing expenses. Shareholders may revoke their consent to future householding mailings or enroll in householding by contacting the Company’s facilitator for distribution of Proxy Materials, Broadridge Financial Solutions, Inc., at1-800-542-1061, or by writing to Broadridge, Householding Department, 51 Mercedes Way, Edgewood, New York 11717. Alternatively, if you wish to receive a separate set of Proxy Materials for this year’s Annual Meeting, we will deliver them promptly upon request to Investor Relations, Horace Mann Educators Corporation, 1 Horace Mann Plaza,C-120, Springfield, Illinois, 62715-0001 or217-789-2500. Submitting Shareholder Proposals for the 20172019 Annual Meeting of Shareholders Any proposals of Shareholders submitted under Rule14a-8 of the Securities Exchange Act of 1934, as amended, for inclusion in the Company’s Proxy Statement and Form of Proxy for the next Annual Meeting of Shareholders scheduled to be held in 20172019 must be received in writing by the Corporate Secretary, Horace Mann Educators Corporation, 1 Horace Mann Plaza, Springfield, Illinois, 62715-0001 not later than the close of business on December 12, 20167, 2018 in order for such proposal to be considered for inclusion in the Company’s Proxy Statement and Form of Proxy relating to the 20172019 Annual Meeting of Shareholders. | | | | 48 | | 2018 Proxy Statement • Other Matters |
In the event that a Shareholder intends to present any proposal at the 20172019 Annual Meeting of Shareholders other than in accordance with the procedures set forth in Rule14a-8, the Shareholder must give written notice to the Corporate Secretary no less than 45 days prior to the date of the Annual Meeting setting forth the business to be brought before the meeting. Accordingly, proxies solicited by the Board for the 20172019 Annual Meeting will confer upon the proxy holders discretionary authority to vote on any matter so presented of which the Company does not have notice prior to April 9, 2017,7, 2019, which is 45 days prior to the anticipated Annual Meeting date of May 24, 2017.22, 2019. | | | 20162018 Proxy Statement • Other Matters | | 3749 |
| | |   | | horacemann.com |


HA-C00377HA-C00381 (Mar. 16)18)
| | | | | | | | | 
| | 
 | |  |  | | | | VOTE BY INTERNET - www.proxyvote.com | |  | | | Use the Internet to transmit your voting instructions and for electronic delivery of information up untilinformation. Vote by 11:59 P.M. Eastern Time the day before the cut-off date or meeting date.ET on 05/22/2018 for shares held directly and by 11:59 P.M. ET on 05/20/2018 for shares held in a Plan. Have your proxy card in hand when you access the web site and follow the instructions to obtain your records and to create an electronic voting instruction form. | | | | | | ELECTRONIC DELIVERY OF FUTURE PROXY MATERIALS | | | | If you would like to reduce the costs incurred by our company in mailing proxy materials, you can consent to receiving all future proxy statements, proxy cards and annual reports electronically via e-mail or the Internet. To sign up for electronic delivery, please follow the instructions above to vote using the Internet and, when prompted, indicate that you agree to receive or access proxy materials electronically in future years. | | | | | | VOTE BY PHONE - 1-800-690-6903 | | | | Use any touch-tone telephone to transmit your voting instructions up untilinstructions. Vote by 11:59 P.M. Eastern Time the day before the cut-off date or meeting date.ET on 05/22/2018 for shares held directly and by 11:59 P.M. ET on 05/20/2018 for shares held in a Plan. Have your proxy card in hand when you call and then follow the instructions. | | | | VOTE BY MAIL | | | | Mark, sign and date your proxy card and return it in the postage-paid envelope we have provided or return it to Vote Processing, c/o Broadridge, 51 Mercedes Way, Edgewood, NY 11717. | | | | | | | |  |
KEEP THIS PORTION FOR YOUR RECORDS DETACH AND RETURN THIS PORTION ONLY THIS PROXY CARD IS VALID ONLY WHEN SIGNED AND DATED. | | | TO VOTE, MARK BLOCKS BELOW IN BLUE OR BLACK INK AS FOLLOWS: x
| | KEEP THIS PORTION FOR YOUR RECORDS | DETACH AND RETURN THIS PORTION ONLY
THIS PROXY CARD IS VALID ONLY WHEN SIGNED AND DATED.
|
| | | | | | | | | | | | | | | | | | | | | | | | | | | | | | | | | | | | | | | | | | | | | | | | | | | | | | | | | |  | | |  | | The Board of Directors recommends you vote FOR the following:
| | | | | | | | | | | | | | |  | | 1. | | Election of Directors
Nominees
| | For | | Against | | Abstain | | | | | | | | | | 1a Daniel A. Domenech
1b Stephen J. Hasenmiller
1c Ronald J. Helow
1d Beverley J. McClure
1e H. Wade Reece
1f Gabriel L. Shaheen
1g Robert Stricker
1h Steven O. Swyers
1i Marita Zuraitis
| | ¨
¨
¨
¨
¨
¨
¨
¨
¨
| | ¨
¨
¨
¨
¨
¨
¨
¨
¨
| | ¨
¨
¨
¨
¨
¨
¨
¨
¨
| | | | The Board of Directors recommends you vote FOR proposals 2 and 3.
| | | | | | | | | | | | | | | | | | | | | | For
| | Against
| | Abstain
| | | | | | | | | | | | 2
| | Approval of the advisory resolution to approve Named Executive Officers' compensation.
| | ¨
| | ¨
| | ¨
| | | | | | | | | | | | 3
| | Ratification of the appointment of KPMG LLP, an independent registered public accounting firm, as the company's auditors for the year ending December 31, 2016.
| | ¨ | | ¨ | | ¨ | | | | | | | | | | | | NOTE: Such other business as may properly come before the meeting or any adjournment thereof.
| | | | | | | | | | | | | | | | | | | | | | | | | | | | | | | | | | | | | | | | | | | | | | | | | | | | | | | | | | | Materials Election - Check this box if you want to receive a complete set of future proxy materials by mail, at no extra cost. If you do not take action you may receive only a Notice to inform you of the Internet availability of proxy materials.
| | ¨
| | | | | | | | | | Please sign exactly as your name(s) appear(s) hereon. When signing as attorney, executor, administrator, or other fiduciary, please give full title as such. Joint owners should each sign personally. All holders must sign. If a corporation or partnership, please sign in full corporate or partnership name by authorized officer. | | | | | | | | | | | | | | | | | | | | The Board of Directors recommends you vote
FOR the following: | | | | | | | | 
| | SHARES
| | | | | | | | | | | | | | | | | | | | | | | | | | | | | | | | | | | | | | | | | | | | | | | | | | | | | | | | | | | | | | | | | | | | | | | | | | | | | | | | | | | | | | | | | | | | | 1. | | Election of Directors | | | | | | | | | | | | | | | | | | | | | | | | | | | | | | | | | | | | | | | CUSIP # Nominees
SEQUENCE #
| | For | | Against | | Abstain | | | | | | | | | |
| The Board of Directors recommends you vote FOR
Proposals 2 and 3. | | For | | Against | | Abstain | | | | | | | | | | | | | | | | 1a | | Daniel A. Domenech | | ☐ | | ☐ | | ☐ | | | | | | | | | | | | | | | | | | | | | | | | | 1b | | Stephen J. Hasenmiller | | ☐ | | ☐ | | ☐ | | | | | | | | | | | 2 | | | Approval of the advisory resolution to approve Named Executive Officers’ compensation. | | ☐ | | ☐ | | ☐ | | | | | | | | | | | | | | | | 1c | | Ronald J. Helow | | ☐ | | ☐ | | ☐ | | | | | | | | | | | | | | | | | | | | | | | | | | | | | | 1d | | Perry G. Hines | | ☐ | | ☐ | | ☐ | | | | | | | | | | | 3 | | | Ratification of the appointment of KPMG LLP, an independent registered public accounting firm, as the company’s auditors for the year ending December 31, 2018. | | ☐ | | ☐ | | ☐ | | | | | | | | | | | | | | | | | 1e | | Beverley J. McClure | | ☐ | | ☐ | | ☐ | | | | | | | | | | | | | | | | | | | | | | | | | | | | | | 1f | | H. Wade Reece | | ☐ | | ☐ | | ☐ | | | | | | | | | | | | | | | | | | | | | | | | | | | | | | 1g | | Robert Stricker | | ☐ | | ☐ | | ☐ | | | | | | | | | |
| NOTE: Such other business as may properly come
before the meeting or any adjournment thereof. | | | | | | | | | | | | | | | | | | | | | | | 1h | | Steven O. Swyers | | ☐ | | ☐ | | ☐ | | | | | | | | | | | | | | | | | | | | | | | | | | | | | | | | 1i | | Marita Zuraitis | | ☐ | | ☐ | | ☐ | | | | | | | | | | | | | | | | | | | | | | | | | | | | | | | | | | | | | | | | | | | | | | | | | | | | | | | | | | | | | | | | | | | | | | | | | | | | | | | | | | | | | | | | | | | | | | | | | | | | | | | | | | | | | | | | | | | | | | | | | | | | | | | | | | | | | | | | | | | | | | | | | | | | | | | | | | | | | | | | | | | | | | | | | | | | | | 
| | | | | | Please sign exactly as your name(s) appear(s) hereon. When signing as attorney, executor, administrator, or other fiduciary, please give
full title as such. Joint owners should each sign personally. All holders must sign. If a corporation or partnership, please sign in full
corporate or partnership name by authorized officer. | | | | | | | | | | | | | | | | | | | | | | | | | | | | | | | | | | | | | | | | | | | | | | | | | | | | | | | | | | | | | | | | | | | | | | | | | | | | | | | | | | | | | | | | | | SHARES | | | | | | | | | | | | | | | | | | | | | | | | | | | | | | | | | | | | | | | | | | | | | CUSIP # | | | | | | | | | | | | | | | | | | | | | | | | | JOB # | | | | | | | | | | | | | | | | | | Signature [PLEASE SIGN WITHIN BOX]
| | Date
| | | | | | | | | | Signature (Joint Owners)
| | | | SEQUENCE # | | | | | | | | | | | | | | | | | Signature [PLEASE SIGN WITHIN BOX] | | Date | | | | | | | Signature (Joint Owners) | | | | | Date | | | | |
| | | | | | | | | | | 
| |  | | | | | | | | | | | | | | | | | | | | | | | | | | | | | | | | | | | | | | | | | | | | | | | | | | | | | | | | | | | | | | | | | | | | | | | | | | | | | | | | | | | | | | | | | | | | | | | | | | | | | | | |
Important Notice Regarding the Availability of Proxy Materials for the Annual Meeting: The Notice & Proxy Statement and Form10-K/Annual Report is/are available atwww.proxyvote.com | | | — — — — — — — — — — — — — — — — — — — — — — — — — — — — — — — — — — — |
| | | | | | | | | | | | | | 
| | | | | | | | | | | | | | | HORACE MANN EDUCATORS CORPORATION | | | | | | | | | | | | | | PROXY SOLICITED ON BEHALF OF THE BOARD OF DIRECTORS | | | | | | | | | | | | | | FOR THE ANNUAL MEETING OF SHAREHOLDERS MAY 25, 2016 23, 2018 | | | | | | | | | | | | | | | | | | | | The undersigned Shareholder of Horace Mann Educators Corporation (the “Company”) hereby appoints Gabriel L. Shaheen and Marita Zuraitis, or any of them, with full power of substitution, proxies to vote at the Annual Meeting of Shareholders of the Company (the “Meeting”), to be held on May 25, 201623, 2018 at 9:00 a.m. Central Daylight Saving Time, at the Horace Mann Lincoln Auditorium, 1 Horace Mann Plaza, Springfield, Illinois, and at any adjournment thereof and to vote all shares of Common Stock of the Company held or owned by the Undersigned as directed on the reverse side and in their discretion upon such other matters as may come before the Meeting. | | | | | | | 
| | | | THIS PROXY CARD, WHEN PROPERLY EXECUTED, WILL BE VOTED IN THE MANNER DIRECTED HEREIN BY THE UNDERSIGNED. IF NO DIRECTION IS MADE BUT THE CARD IS SIGNED, THIS PROXY CARD WILL BE VOTED FOR THE ELECTION OF ALL NOMINEES UNDER PROPOSAL 1, FOR PROPOSALS 2 AND 3, AND IN THE DISCRETION OF THE PROXIES WITH RESPECT TO SUCH OTHER BUSINESS AS MAY PROPERLY COME BEFORE THE MEETING. | | | | | | Continued and to be signed on reverse side | | |
|